22h ago20/11/2026, 6:37:34 pm
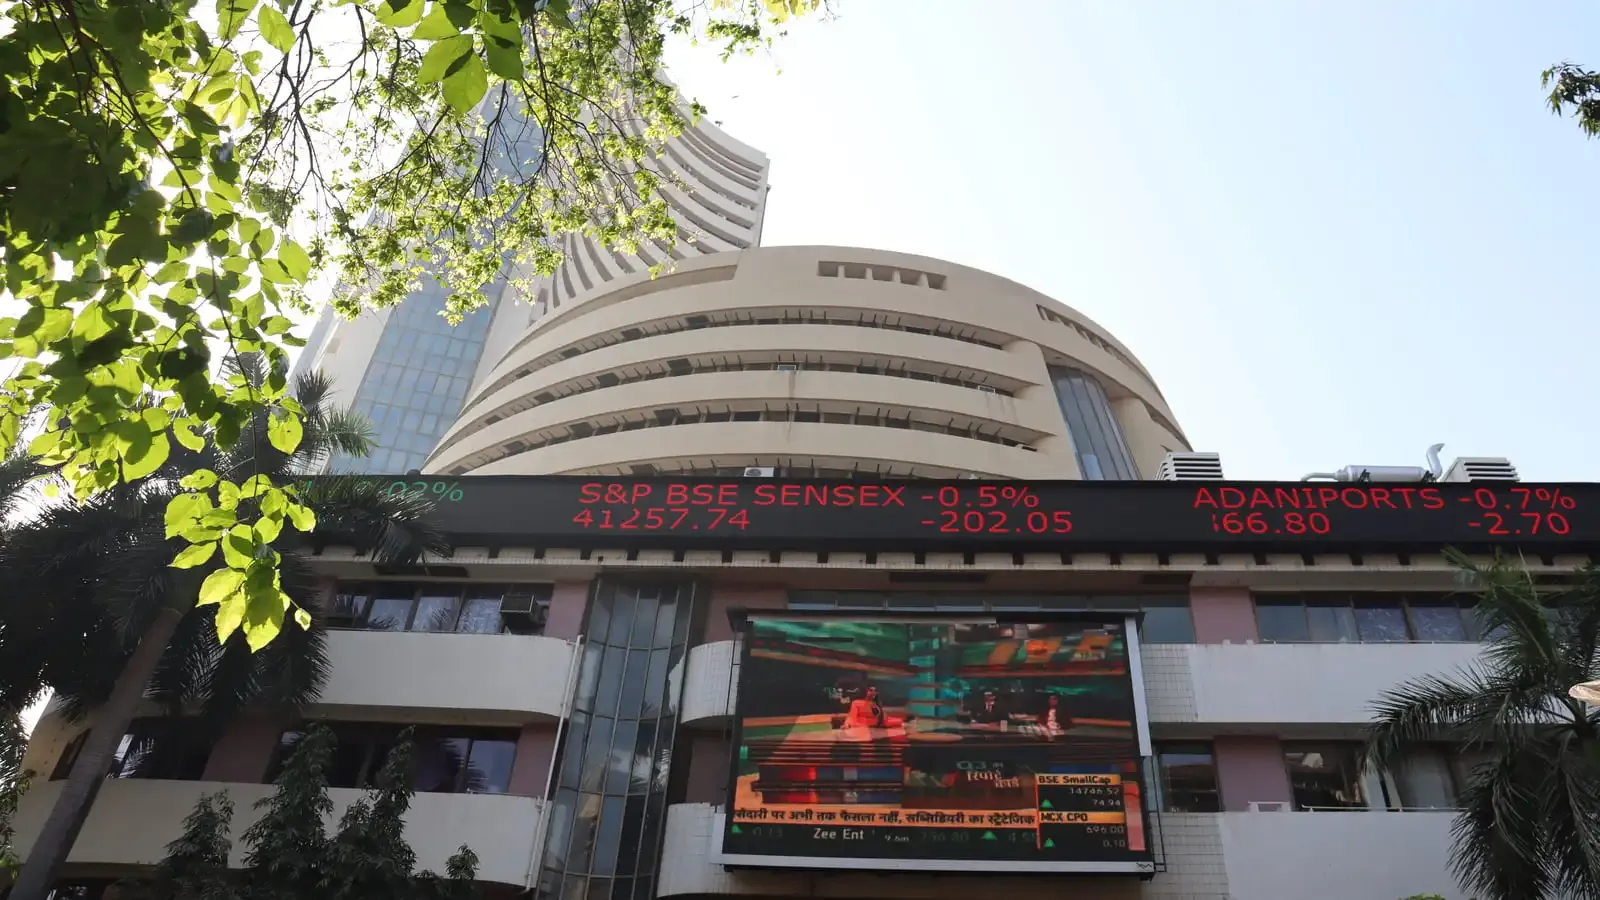
Sensex rejig: Shriram Finance replaces Trent; Vedanta Aluminium, MCX enters BSE 100The changes will be done in BSE 100, BSE Sensex 50, BSE Sensex Next 50, BSE Sensex NEXT 30 and BSE Focused IT.
as of 21/11/2026, 4:45:13 pm
02/Price history
1 year · daily candles. Hover the chart for the OHLC of any candle; the table below holds the same data row by row.
| 20 Nov 2026 | 428.00 | 435.00 | 425.35 | 433.65 | +1.32% | 9.65 | 60.73 L |
| 19 Nov 2026 | 420.90 | 435.20 | 419.00 | 435.00 | +3.35% | 16.20 | 60.29 L |
| 18 Nov 2026 | 429.90 | 430.90 | 418.10 | 421.70 | -1.91% | 12.80 | 65.35 L |
| 17 Nov 2026 | 427.90 | 435.10 | 425.25 | 430.65 | +0.64% | 9.85 | 48.15 L |
| 16 Nov 2026 | 437.00 | 438.00 | 425.60 | 430.10 | -1.58% | 12.40 | 73.36 L |
| 13 Nov 2026 | 427.80 | 438.30 | 421.00 | 436.30 | +1.99% | 17.30 | 76.28 L |
| 12 Nov 2026 | 434.05 | 434.40 | 426.10 | 431.20 | -0.66% | 8.30 | 54.70 L |
| 11 Nov 2026 | 429.05 | 437.00 | 425.75 | 432.00 | +0.69% | 11.25 | 1.15 Cr |
| 9 Nov 2026 | 420.50 | 426.25 | 414.40 | 422.95 | +0.58% | 11.85 | 1.01 Cr |
| 8 Nov 2026 | 420.00 | 421.50 | 416.10 | 417.20 | -0.67% | 5.40 | 11.93 L |
Historical price and volume data · Showing 1–10 of 248
03/Valuation & returns
Company value benchmarked against the sector median. The ratio set is sector specific — banks report NIM, CASA and Net NPA instead of EV/EBITDA.
Price ÷ earnings per share
Worse than sector by 313%
Price ÷ book value per share
Worse than sector by 15%
Net income ÷ total assets
Worse than sector by 43%
Net income ÷ shareholders' equity
Better than sector by 5%
EBIT ÷ capital employed
Worse than sector by 22%
Liquid assets ÷ current liabilities
Worse than sector by 68%
Enterprise value ÷ EBITDA
Worse than sector by 1222%
04/Business
Sector: Engineering
Bharat Heavy Electricals Limited is an engineering and manufacturing company. The Company offers comprehensive products, systems, and services in various areas, including power generation (thermal, hydro, gas, nuclear, and solar photovoltaic), transmission, transportation, defense, aerospace, oil and gas, and emerging sectors like battery energy storage systems and electric vehicle chargers. The Company operates through two business segments: Power and Industry. The Power segment comprises thermal, gas, hydro and nuclear power plant businesses, spares and services businesses, apart from new businesses of coal to chemicals, emission control equipment and spares. The Industry segment caters to major equipment supplies and engineering, procurement and construction (EPC) works for a number of industries, including transportation, transmission, defense, aerospace, captive power plants, process industries, renewables, downstream oil & gas, and energy storage, among others.
reported in crore
reported in billion
Market capitalisation is reported at the sector-constituent level, not the standalone company level.
05/Profit & loss
Annual figures in ₹ crore. Growth marked reported is provided; margins are derived.
| Revenue | 34,629 | 28,843 | 24,481 | 23,880 |
|---|---|---|---|---|
| Revenue growthreported | 20.1% | 17.8% | 2.5% | — |
| Operating profit | 2,116 | 725 | 220 | 686 |
| Operating profit growthreported | 192.0% | 228.9% | -67.9% | — |
| Operating marginderived | 6.1% | 2.5% | 0.9% | 2.9% |
| Net profit | 1,578 | 513 | 260 | 624 |
| Net profit growthreported | 207.6% | 97.4% | -58.4% | — |
| Net marginderived | 4.6% | 1.8% | 1.1% | 2.6% |
| EPS — basic₹/share, annual | 4.53 | 0.47 | 0.75 | 1.79 |
Figures in ₹ crore. Margin rows are computed from the reported values.
| Revenue | 33,782 | 28,339 | 23,893 | 23,365 |
|---|---|---|---|---|
| Other Income | 846 | 503 | 588 | 515 |
| Total Revenue | 34,629 | 28,843 | 24,481 | 23,880 |
| Total Expenses | 32,512 | 28,118 | 24,260 | 23,194 |
| Profit Before Tax | 2,116 | 725 | 220 | 686 |
| Tax | 538 | 212 | -40 | 61 |
| Profit After Tax | 1,578 | 513 | 260 | 624 |
| EPS - Basic | 4.53 | 0.47 | 0.75 | 1.79 |
| EPS - Diluted | 4.53 | 0.47 | 0.75 | 1.79 |
This breakdown is available annually, even when the summary above is quarterly. EPS rows are per share.
06/Balance sheet
Only annual balance sheets are available — the quarterly filter does not apply here. Figures in ₹ crore; net worth is assets minus liabilities.
| Total assets | 76,560 | 68,479 | 59,414 | 57,354 |
|---|---|---|---|---|
| Total liabilities | 50,044 | 43,366 | 34,563 | 32,542 |
| Net worthderived | 26,516 | 25,113 | 24,851 | 24,812 |
| Liabilities ÷ assetsderived | 65.4% | 63.3% | 58.2% | 56.7% |
| Asset growthderived | 11.8% | 15.3% | 3.6% | — |
Figures in ₹ crore. Stacked chart height equals total assets.
| Non-Current Assets | 25,105 | 25,720 | 24,872 | 28,260 |
|---|---|---|---|---|
| Current Assets | 51,455 | 42,760 | 34,542 | 29,095 |
| Total Assets | 76,560 | 68,479 | 59,414 | 57,354 |
| Current Liabilities | 32,307 | 28,231 | 25,247 | 23,480 |
| Net Current Asset | 19,149 | 14,529 | 9,295 | 5,615 |
| Non-Current Liabilities | 17,737 | 15,135 | 9,316 | 9,062 |
| Equity Capital | 26,516 | 25,113 | 24,851 | 24,812 |
| Total Equity & Liabilities | 76,560 | 68,479 | 59,414 | 57,354 |
Figures in ₹ crore unless the line item is per-share.
07/Cash flow
Annual only, in ₹ crore. Negative values are outflows, so healthy companies usually show positive operating and negative investing cash flow.
| Operating activities | 5,837 | 2,192 | -3,713 | -741 |
|---|---|---|---|---|
| Operating changereported | 166.3% | 159.1% | -401.3% | — |
| Investing activities | -3,035 | -2,731 | 1,331 | 1,480 |
| Investing changereported | -11.1% | -305.2% | -10.1% | — |
| Financing activities | -1,806 | -857 | 2,656 | 89 |
| Financing changereported | -110.8% | -132.3% | 2885.3% | — |
| Net cash flowderived | 996 | -1,396 | 274 | 829 |
| Free cash flowoperating + investing | 2,802 | -539 | -2,382 | 740 |
Figures in ₹ crore.
| Profit before tax | 2,116 | 725 | 220 | 686 |
|---|---|---|---|---|
| Income before WC changes | 1,743 | 381 | -490 | -54 |
| Change in Assets | -3,450 | -7,044 | -3,723 | -2,678 |
| Change in Liabilities | 7,533 | 8,774 | 279 | 1,881 |
| Change in WC | 4,084 | 1,730 | -3,445 | -797 |
| Cash flow from Operations | 5,837 | 2,192 | -3,713 | -741 |
| Cash flow from Investing | -3,035 | -2,731 | 1,331 | 1,480 |
| Cash flow from Financing | -1,806 | -857 | 2,656 | 89 |
| Total Cash Flow | 996 | -1,396 | 274 | 829 |
| Cash (Start of the year) | 439 | 1,835 | 1,561 | 733 |
| Cash (End of the year) | 1,435 | 439 | 1,835 | 1,561 |
Figures in ₹ crore unless the line item is per-share.
09/Events
Dividends, bonuses, splits and rights issues. Filter by type, sort by any date, and expand a row for the full event detail.
| DividendFinal | ₹1.40 | 70.0% | 17 Jul 2026 | 17 Jul 2026 | 04 May 2026 |
10/Comparison
Competitor set priced live. Filter by sector, sort any column, and expand a peer for its business description.
| ABBABB India Limited | Electric Equipment | ₹6,934.50 | -0.24% | 1.39 L | ₹1,46,535 Cr | $16.28B | |
| POWERINDIAHitachi Energy India Ltd | Electric Equipment | ₹30,150.00 | -1.95% | 1.55 L | ₹1,34,386 Cr | $14.93B | |
| SIEMENSSiemens Ltd | Electric Equipment | ₹3,582.60 | -0.76% | 1.78 L | ₹1,27,546 Cr | $14.17B | |
| CGPOWERCG Power And IND SOL Ltd | Electric Equipment | ₹792.00 | -2.57% | 43.31 L | ₹1,24,724 Cr | $13.86B | |
| GVT&DGE Vernova T&D India Ltd | Electric Equipment | ₹4,235.00 | -2.63% | 6.81 L | ₹1,08,668 Cr | $12.07B | |
| ENRINSiemens Energy India Ltd | Capital Goods - Electrical Equipment | ₹2,944.00 | -2.19% | 5.64 L | ₹1,04,984 Cr | $11.66B | |
| WAAREEENERWaaree Energies Limited | Capital Goods - Electrical Equipment | ₹2,461.00 | +1.15% | 5.37 L | ₹70,759 Cr | $7.86B | |
| APARINDSApar Industries Ltd. | Electric Equipment | ₹14,320.00 | -0.82% | 1.30 L | ₹60,030 Cr | $6.67B | |
| SUZLONSuzlon Energy Limited | Electric Equipment | ₹36.96 | +0.03% | 4.66 Cr | ₹50,386 Cr | $5.60B | |
| DHOOTTRANSDhoot Transmission Ltd | Capital Goods - Electrical Equipment | ₹1,597.30 | -1.16% | 2.46 L | ₹32,663 Cr | $3.63B |
Market cap is the sector-constituent figure reported per peer · Showing 1–10 of 10
11/Coverage
Articles published in the last seven days, paginated by the provider.
The changes will be done in BSE 100, BSE Sensex 50, BSE Sensex Next 50, BSE Sensex NEXT 30 and BSE Focused IT.
Showing 1–1 of 1 article