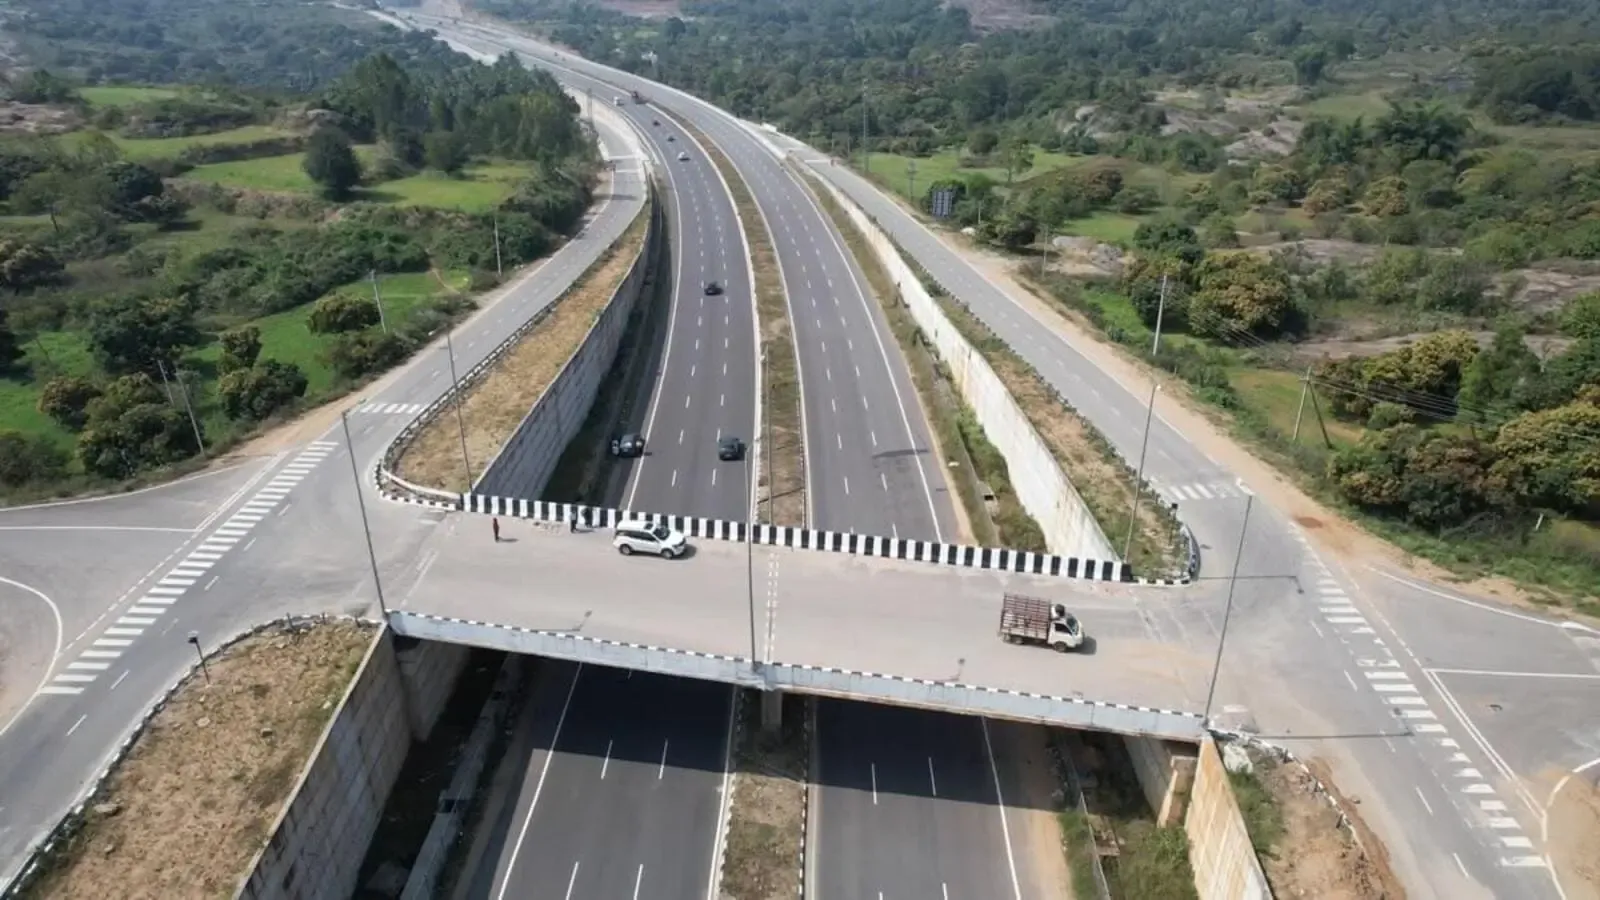
Dilip Buildcon stock gained as much as 7% to touch an intraday high of ₹414.70 per equity share on Friday, November 20, a day after the company said it had bagged an order worth ₹419 crore from Gurugram Metro Rail.
as of 22/11/2026, 1:17:30 pm
02/Price history
5 years · weekly candles. Hover the chart for the OHLC of any candle; the table below holds the same data row by row.
| 16 Nov 2026 | 408.00 | 414.70 | 381.00 | 402.45 | -1.36% | 33.70 | 55.63 L |
| 9 Nov 2026 | 401.20 | 414.95 | 390.40 | 409.10 | +1.97% | 24.55 | 11.62 L |
| 2 Nov 2026 | 377.00 | 404.90 | 372.70 | 401.25 | +6.43% | 32.20 | 4.16 L |
| 26 Oct 2026 | 360.25 | 397.75 | 356.25 | 375.80 | +4.32% | 41.50 | 9.64 L |
| 19 Oct 2026 | 402.00 | 402.15 | 352.80 | 360.45 | -10.34% | 49.35 | 4.48 L |
| 12 Oct 2026 | 396.90 | 407.65 | 388.05 | 402.00 | +1.28% | 19.60 | 4.41 L |
| 5 Oct 2026 | 398.05 | 415.20 | 393.10 | 395.65 | -0.60% | 22.10 | 6.39 L |
| 28 Sept 2026 | 412.00 | 416.00 | 396.55 | 399.10 | -3.13% | 19.45 | 5.60 L |
| 21 Sept 2026 | 427.10 | 433.65 | 407.05 | 412.45 | -3.43% | 26.60 | 17.74 L |
| 14 Sept 2026 | 405.00 | 428.50 | 390.40 | 425.50 | +5.06% | 38.10 | 12.69 L |
Historical price and volume data · Showing 1–10 of 261
03/Valuation & returns
Company value benchmarked against the sector median. The ratio set is sector specific — banks report NIM, CASA and Net NPA instead of EV/EBITDA.
Price ÷ earnings per share
Better than sector by 79%
Price ÷ book value per share
Better than sector by 85%
Net income ÷ total assets
Better than sector by 140%
Net income ÷ shareholders' equity
Worse than sector by 4%
EBIT ÷ capital employed
Better than sector by 70%
Liquid assets ÷ current liabilities
Worse than sector by 96%
Enterprise value ÷ EBITDA
Better than sector by 94%
04/Business
Sector: Construction
Dilip Buildcon Limited is an India-based engineering, procurement and construction (EPC) company. The Company is engaged in the business of infrastructure activity. Its core business comprises constructing state and national highways. It has two reportable segments, namely Engineering, Procurement and Construction (EPC) Projects & Road Infrastructure Maintenance and Annuity Projects & Others. It is also engaged in coal mining operations, which with two Mining Developer Cum Operator (MDO) projects - at Siarmal, Odisha and Pachhwara, Jharkhand. The Company's projects span roads and highways, sewage treatment, dams, rails and metro, airports, mining, irrigation, tunnels, bridges, commercial buildings, and urban development. Its completed projects include Zuari Bridge (Package-II), Churahat Bypass of Rewa Sidhi, Gorakhpur Link Expressway, Uttar Pradesh, and others. Its subsidiaries include DBL Chandikhole Bhadrak Highways Limited, DBL Nidagatta Mysore Highways Private Limited, and others.
reported in crore
reported in million
Market capitalisation is reported at the sector-constituent level, not the standalone company level.

05/Profit & loss
Quarterly figures in ₹ crore. Growth marked reported is provided; margins are derived.
| Revenue | 2,312 | 2,425 | 2,361 | 2,308 |
|---|---|---|---|---|
| Revenue growthreported | -4.6% | 2.7% | 2.3% | — |
| Operating profit | 178 | 157 | 153 | 713 |
| Operating profit growthreported | 13.4% | 2.6% | -78.5% | — |
| Operating marginderived | 7.7% | 6.5% | 6.5% | 30.9% |
| Net profit | 101 | 128 | 124 | 789 |
| Net profit growthreported | -21.0% | 3.3% | -84.3% | — |
| Net marginderived | 4.4% | 5.3% | 5.2% | 34.2% |
| EPS — basic₹/share, annual | — | — | 86.08 | — |
Figures in ₹ crore. Margin rows are computed from the reported values.
| Revenue | 8,984 | 11,317 | 12,012 | 10,644 |
|---|---|---|---|---|
| Other Income | 516 | 136 | 144 | 68 |
| Total Revenue | 9,500 | 11,453 | 12,156 | 10,712 |
| Total Expenses | 8,919 | 10,761 | 11,982 | 10,987 |
| Profit Before Tax | 1,461 | 981 | 492 | 103 |
| Tax | 63 | 141 | 291 | 105 |
| Profit After Tax | 1,398 | 840 | 201 | -1 |
| EPS - Basic | 86.08 | 57.44 | 13.75 | -0.10 |
| EPS - Diluted | 86.08 | 51.71 | 12.38 | -0.10 |
This breakdown is available annually, even when the summary above is quarterly. EPS rows are per share.
06/Balance sheet
Only annual balance sheets are available — the quarterly filter does not apply here. Figures in ₹ crore; net worth is assets minus liabilities.
| Total assets | 18,908 | 19,709 | 16,640 | 15,439 |
|---|---|---|---|---|
| Total liabilities | 11,947 | 14,455 | 12,266 | 11,441 |
| Net worthderived | 6,962 | 5,255 | 4,374 | 3,998 |
| Liabilities ÷ assetsderived | 63.2% | 73.3% | 73.7% | 74.1% |
| Asset growthderived | -4.1% | 18.4% | 7.8% | — |
Figures in ₹ crore. Stacked chart height equals total assets.
| Non-Current Assets | 9,506 | 9,905 | 7,658 | 6,856 |
|---|---|---|---|---|
| Current Assets | 9,402 | 9,805 | 8,982 | 8,583 |
| Total Assets | 18,908 | 19,709 | 16,640 | 15,439 |
| Current Liabilities | 6,015 | 6,638 | 6,787 | 6,929 |
| Net Current Asset | 3,387 | 3,167 | 2,196 | 1,654 |
| Non-Current Liabilities | 5,931 | 7,817 | 5,479 | 4,512 |
| Equity Capital | 6,962 | 5,255 | 4,374 | 3,998 |
| Total Equity & Liabilities | 18,908 | 19,709 | 16,640 | 15,439 |
Figures in ₹ crore unless the line item is per-share.
07/Cash flow
Annual only, in ₹ crore. Negative values are outflows, so healthy companies usually show positive operating and negative investing cash flow.
| Operating activities | 1,204 | 131 | 1,080 | 2,845 |
|---|---|---|---|---|
| Operating changereported | 819.2% | -87.9% | -62.0% | — |
| Investing activities | 468 | -731 | -111 | 26 |
| Investing changereported | 164.0% | -560.1% | -529.5% | — |
| Financing activities | -2,503 | 1,022 | -431 | -3,028 |
| Financing changereported | -344.9% | 337.0% | 85.8% | — |
| Net cash flowderived | -831 | 422 | 539 | -157 |
| Free cash flowoperating + investing | 1,672 | -600 | 970 | 2,871 |
Figures in ₹ crore.
| Profit before tax | 1,461 | 981 | 492 | 103 |
|---|---|---|---|---|
| Income before WC changes | 2,203 | 2,245 | 1,519 | 1,083 |
| Change in Assets | 468 | -2,032 | -515 | 825 |
| Change in Liabilities | -1,268 | -97 | 243 | 775 |
| Change in WC | -799 | -2,129 | -273 | 1,600 |
| Cash flow from Operations | 1,204 | 131 | 1,080 | 2,845 |
| Cash flow from Investing | 468 | -731 | -111 | 26 |
| Cash flow from Financing | -2,503 | 1,022 | -431 | -3,028 |
| Total Cash Flow | -831 | 422 | 539 | -157 |
| Cash (Start of the year) | 1,158 | 736 | 198 | 583 |
| Cash (End of the year) | 86 | 463 | 468 | 198 |
Figures in ₹ crore unless the line item is per-share.
09/Events
Dividends, bonuses, splits and rights issues. Filter by type, sort by any date, and expand a row for the full event detail.
| DividendFinal | ₹1.00 | 10.0% | 15 Sep 2026 | 15 Sep 2026 | 14 May 2026 |
10/Comparison
Competitor set priced live. Filter by sector, sort any column, and expand a peer for its business description.
| LTLarsen & Toubro Ltd. | Engineering | ₹4,209.10 | -0.05% | 21.54 L | ₹5,78,022 Cr | $64.22B | |
| RVNLRail Vikas Nigam Limited | Engineering | ₹191.00 | -2.05% | 69.46 L | ₹39,855 Cr | $4.43B | |
| ACMESOLARAcme Solar Holdings Ltd | Power | ₹406.00 | -0.77% | 6.26 L | ₹28,660 Cr | $3.18B | |
| CEMPROCemindia Projects Limited | Engineering | ₹1,415.90 | +2.71% | 3.83 L | ₹26,106 Cr | $2.90B | |
| KPILKalpataru Project INT Ltd | Engineering | ₹1,320.10 | -0.06% | 65.1K | ₹22,637 Cr | $2.52B | |
| IRBIRB Infra DEV Ltd. | Engineering | ₹18.05 | +2.97% | 1.98 Cr | ₹21,789 Cr | $2.42B | |
| ENGINERSINEngineers India Ltd | Engineering | ₹296.55 | -3.56% | 17.85 L | ₹16,676 Cr | $1.85B | |
| JNPRJuniper Green Energy Ltd | Infrastructure Developers & Operators | ₹247.45 | +1.99% | 1.46 L | ₹14,123 Cr | $1.57B | |
| WABAGVA Tech Wabag Ltd | Capital Goods | ₹1,866.10 | -0.91% | 1.98 L | ₹11,667 Cr | $1.30B | |
| TECHNOETechno Elec & ENG CO. Ltd | Engineering | ₹922.40 | -1.13% | 59.9K | ₹10,727 Cr | $1.19B |
Market cap is the sector-constituent figure reported per peer · Showing 1–10 of 10
11/Coverage
Articles published in the last seven days, paginated by the provider.

Dilip Buildcon stock gained as much as 7% to touch an intraday high of ₹414.70 per equity share on Friday, November 20, a day after the company said it had bagged an order worth ₹419 crore from Gurugram Metro Rail.

NLC India Renewables, a wholly owned subsidiary of state-owned NLC India, has filed its draft red herring prospectus (DRHP) with SEBI for a proposed IPO comprising a fresh issue of shares worth up to ₹3,300 crore and an offer for sale (OFS) of up to 10 crore shares by NLC India.

By the end of September quarter, Dilip Buildcon’s order book stood at ₹33,081 crore, jumping 19% year-on-year (YoY).
Showing 1–3 of 3 articles