Adani Power, LIC, Divi’s Laboratories, Hindustan Aeronautics, Adani Green Energy and others have high market capitalisation compared to the NIFTY50 bottom five stocks. But despite this, the stock is not part of the NIFTY50 index. Here’s why
as of 21/11/2026, 12:45:01 pm
02/Price history
5 years · weekly candles. Hover the chart for the OHLC of any candle; the table below holds the same data row by row.
| 16 Nov 2026 | 4,814.00 | 4,830.50 | 4,644.10 | 4,809.00 | -0.10% | 186.40 | 24.82 L |
| 9 Nov 2026 | 4,985.00 | 5,055.00 | 4,736.60 | 4,809.80 | -3.51% | 318.40 | 51.72 L |
| 2 Nov 2026 | 4,850.00 | 5,119.00 | 4,812.40 | 4,985.00 | +2.78% | 306.60 | 47.60 L |
| 26 Oct 2026 | 4,716.00 | 4,926.10 | 4,642.00 | 4,853.70 | +2.92% | 284.10 | 32.76 L |
| 19 Oct 2026 | 4,980.00 | 5,012.00 | 4,716.30 | 4,725.00 | -5.12% | 295.70 | 32.28 L |
| 12 Oct 2026 | 4,662.00 | 4,989.00 | 4,662.00 | 4,989.00 | +7.01% | 327.00 | 36.07 L |
| 5 Oct 2026 | 4,601.00 | 4,837.10 | 4,590.00 | 4,655.60 | +1.19% | 247.10 | 29.42 L |
| 28 Sept 2026 | 4,790.10 | 4,793.90 | 4,549.30 | 4,601.00 | -3.95% | 244.60 | 38.80 L |
| 21 Sept 2026 | 4,850.00 | 4,888.90 | 4,760.10 | 4,800.00 | -1.03% | 128.80 | 25.08 L |
| 14 Sept 2026 | 4,920.00 | 4,940.00 | 4,615.80 | 4,800.30 | -2.43% | 324.20 | 29.90 L |
Historical price and volume data · Showing 1–10 of 262
03/Valuation & returns
Company value benchmarked against the sector median. The ratio set is sector specific — banks report NIM, CASA and Net NPA instead of EV/EBITDA.
Price ÷ earnings per share
Worse than sector by 516%
Price ÷ book value per share
Worse than sector by 49%
Net income ÷ total assets
Better than sector by 386%
Net income ÷ shareholders' equity
Better than sector by 11%
EBIT ÷ capital employed
Better than sector by 99%
Liquid assets ÷ current liabilities
Worse than sector by 38%
Enterprise value ÷ EBITDA
Better than sector by 19%
04/Business
Sector: Airlines
Hindustan Aeronautics Limited is an India-based company engaged in the design, development, manufacture, repair, overhaul, upgrade, and servicing of a wide range of products, including aircraft, helicopters, aero-engines, avionics, accessories, and aerospace structures. The Company’s aircraft products include the HAWK, Light Combat Aircraft (LCA), SU-30 MKI, Intermediate Jet Trainer (IJT), Dornier, and HTT-40. Its helicopter products include the Dhruv, Cheetah, Chetak, Lancer, Cheetal, Rudra, Light Combat Helicopter (LCH), and Light Utility Helicopter (LUH). Its civil aviation products include Do-228 Aircraft (Civil) and DHRUV (ALH) - NG. Its space products include Structures, Propellant Tank, and Cryogenic Engines. Its system products include Flight Data Recorder, Panel Instruments, Ground Radars, Forgings, Castings, and Others. Its maintenance, repair, and operations (MRO) products include Aircraft MRO, Helicopter MRO, Power Plant Services, and Systems, Accessories and Avionics.
reported in crore
reported in billion
Market capitalisation is reported at the sector-constituent level, not the standalone company level.
05/Profit & loss
Annual figures in ₹ crore. Growth marked reported is provided; margins are derived.
| Revenue | 36,788 | 33,543 | 32,278 | 28,598 |
|---|---|---|---|---|
| Revenue growthreported | 9.7% | 3.9% | 12.9% | — |
| Operating profit | 12,152 | 10,867 | 10,225 | 6,510 |
| Operating profit growthreported | 11.8% | 6.3% | 57.1% | — |
| Operating marginderived | 33.0% | 32.4% | 31.7% | 22.8% |
| Net profit | 9,116 | 8,364 | 7,621 | 5,828 |
| Net profit growthreported | 9.0% | 9.8% | 30.8% | — |
| Net marginderived | 24.8% | 24.9% | 23.6% | 20.4% |
| EPS — basic₹/share, annual | 136.30 | 125.07 | 113.95 | 87.14 |
Figures in ₹ crore. Margin rows are computed from the reported values.
| Revenue | 33,089 | 30,981 | 30,381 | 26,927 |
|---|---|---|---|---|
| Other Income | 3,699 | 2,562 | 1,897 | 1,670 |
| Total Revenue | 36,788 | 33,543 | 32,278 | 28,598 |
| Total Expenses | 24,680 | 22,722 | 22,079 | 22,091 |
| Profit Before Tax | 12,152 | 10,867 | 10,225 | 6,510 |
| Tax | 3,036 | 2,503 | 2,604 | 682 |
| Profit After Tax | 9,116 | 8,364 | 7,621 | 5,828 |
| EPS - Basic | 136.30 | 125.07 | 113.95 | 87.14 |
| EPS - Diluted | 136.30 | 125.07 | 113.95 | 87.14 |
This breakdown is available annually, even when the summary above is quarterly. EPS rows are per share.
06/Balance sheet
Only annual balance sheets are available — the quarterly filter does not apply here. Figures in ₹ crore; net worth is assets minus liabilities.
| Total assets | 1,32,415 | 1,06,267 | 78,095 | 67,204 |
|---|---|---|---|---|
| Total liabilities | 91,370 | 71,282 | 48,953 | 43,628 |
| Net worthderived | 41,045 | 34,985 | 29,142 | 23,576 |
| Liabilities ÷ assetsderived | 69.0% | 67.1% | 62.7% | 64.9% |
| Asset growthderived | 24.6% | 36.1% | 16.2% | — |
Figures in ₹ crore. Stacked chart height equals total assets.
| Non-Current Assets | 16,577 | 16,172 | 15,078 | 15,327 |
|---|---|---|---|---|
| Current Assets | 1,15,838 | 90,095 | 63,017 | 51,877 |
| Total Assets | 1,32,415 | 1,06,267 | 78,095 | 67,204 |
| Current Liabilities | 44,307 | 44,095 | 36,324 | 30,827 |
| Net Current Asset | 71,531 | 45,999 | 26,693 | 21,050 |
| Non-Current Liabilities | 47,063 | 27,186 | 12,629 | 12,801 |
| Equity Capital | 41,045 | 34,985 | 29,142 | 23,576 |
| Total Equity & Liabilities | 1,32,415 | 1,06,267 | 78,095 | 67,204 |
Figures in ₹ crore unless the line item is per-share.
07/Cash flow
Annual only, in ₹ crore. Negative values are outflows, so healthy companies usually show positive operating and negative investing cash flow.
| Operating activities | 10,906 | 13,644 | 8,223 | 8,830 |
|---|---|---|---|---|
| Operating changereported | -20.1% | 65.9% | -6.9% | — |
| Investing activities | -8,337 | -10,771 | -6,410 | -5,728 |
| Investing changereported | 22.6% | -68.0% | -11.9% | — |
| Financing activities | -3,350 | -2,579 | -1,999 | -1,731 |
| Financing changereported | -29.9% | -29.0% | -15.4% | — |
| Net cash flowderived | -781 | 294 | -186 | 1,370 |
| Free cash flowoperating + investing | 2,570 | 2,872 | 1,813 | 3,102 |
Figures in ₹ crore.
| Profit before tax | 9,116 | 8,364 | 7,621 | 5,828 |
|---|---|---|---|---|
| Income before WC changes | 11,697 | 12,426 | 13,317 | 11,134 |
| Change in Assets | -17,469 | -15,332 | -5,907 | -1,457 |
| Change in Liabilities | 19,667 | 20,088 | 2,782 | 1,909 |
| Change in WC | 2,198 | 4,756 | -3,125 | 452 |
| Cash flow from Operations | 10,906 | 13,643 | 8,223 | 8,830 |
| Cash flow from Investing | -8,337 | -10,771 | -6,410 | -5,728 |
| Cash flow from Financing | -3,350 | -2,579 | -1,999 | -1,731 |
| Total Cash Flow | -781 | 294 | -186 | 1,370 |
| Cash (Start of the year) | 4,549 | 4,255 | 4,441 | 3,070 |
| Cash (End of the year) | 3,768 | 4,549 | 4,255 | 4,441 |
Figures in ₹ crore unless the line item is per-share.
09/Events
Dividends, bonuses, splits and rights issues. Filter by type, sort by any date, and expand a row for the full event detail.
| DividendFinal | ₹10.00 | 200.0% | 14 Aug 2026 | 14 Aug 2026 | 29 Jun 2026 | |
| DividendInterim | ₹35.00 | 700.0% | 18 Feb 2026 | 18 Feb 2026 | 12 Feb 2026 |
10/Comparison
Competitor set priced live. Filter by sector, sort any column, and expand a peer for its business description.
| BELBharat Electronics Ltd | Engineering | ₹402.00 | -0.54% | 45.75 L | ₹2,93,159 Cr | $32.57B | |
| SOLARINDSSolar Industries (i) Ltd | Chemicals | ₹18,710.00 | -0.74% | 48.8K | ₹1,68,945 Cr | $18.77B | |
| MAZDOCKMazagon Dock Shipbuil Ltd | Ship Building | ₹1,841.50 | -0.46% | 4.21 L | ₹74,343 Cr | $8.26B | |
| BDLBharat Dynamics Limited | Defence | ₹1,034.50 | +0.20% | 5.67 L | ₹37,873 Cr | $4.21B | |
| COCHINSHIPCochin Shipyard Limited | Ship Building | ₹1,125.00 | -1.16% | 14.47 L | ₹29,597 Cr | $3.29B | |
| ITIITI Ltd | Telecommunication | ₹245.72 | -1.22% | 1.37 L | ₹23,650 Cr | $2.63B | |
| GRSEGarden Reach Ship&eng Ltd | Ship Building | ₹2,061.70 | -1.16% | 1.70 L | ₹23,619 Cr | $2.62B | |
| DATAPATTNSData Patterns India Ltd | Electronics | ₹4,215.00 | +2.48% | 4.88 L | ₹23,601 Cr | $2.62B | |
| SIGMAADVINE933B01012 | IT - Software | ₹919.85 | -2.75% | 97.2K | ₹17,473 Cr | $1.94B | |
| MTARTECHMtar Technologies Limited | Engineering | ₹5,614.50 | -5.70% | 3.21 L | ₹17,255 Cr | $1.92B |
Market cap is the sector-constituent figure reported per peer · Showing 1–10 of 10
11/Coverage
Articles published in the last seven days, paginated by the provider.

Adani Power, LIC, Divi’s Laboratories, Hindustan Aeronautics, Adani Green Energy and others have high market capitalisation compared to the NIFTY50 bottom five stocks. But despite this, the stock is not part of the NIFTY50 index. Here’s why

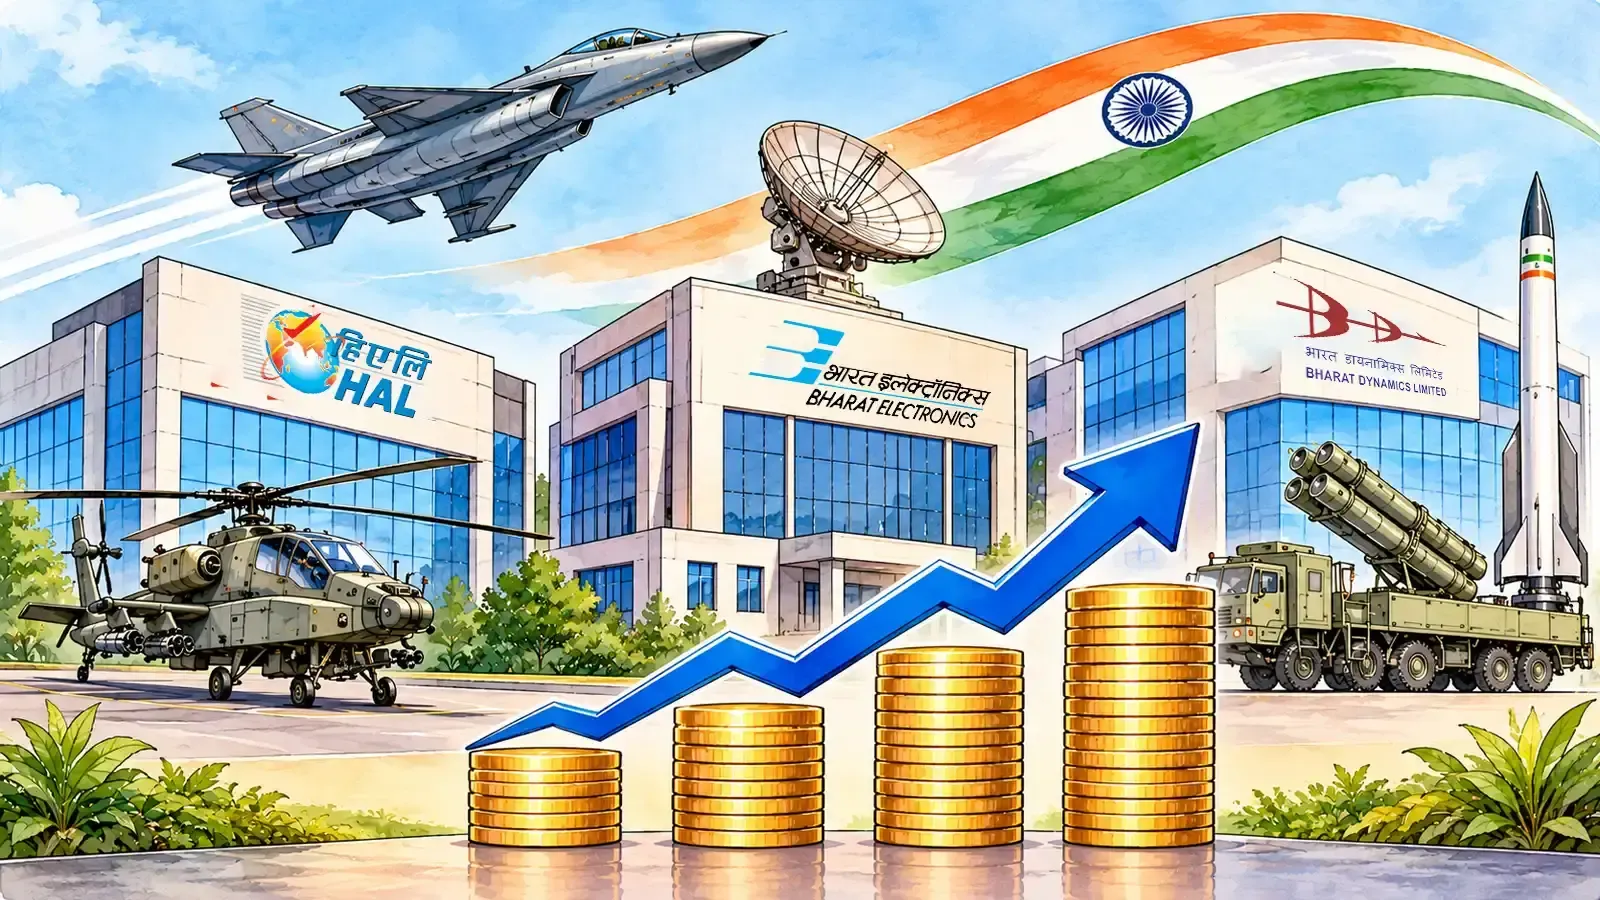
Three major listed defence manufacturers: Hindustan Aeronautics (HAL), Bharat Electronics (BEL) and Bharat Dynamics (BDL) reported contrasting performances in the September quarter. Revenue from operations rose at HAL, BEL and Bharat Dynamics, while net profit grew at HAL and BEL but declined at Bharat Dynamics.

The fund of funds of SBI Defence ETF FOF opens today, November 16, and closes on November 30. The scheme will hold at least 95% in the SBI BSE India Defence ETF, and has a base expense ratio at 0.90%
Showing 1–3 of 3 articles