
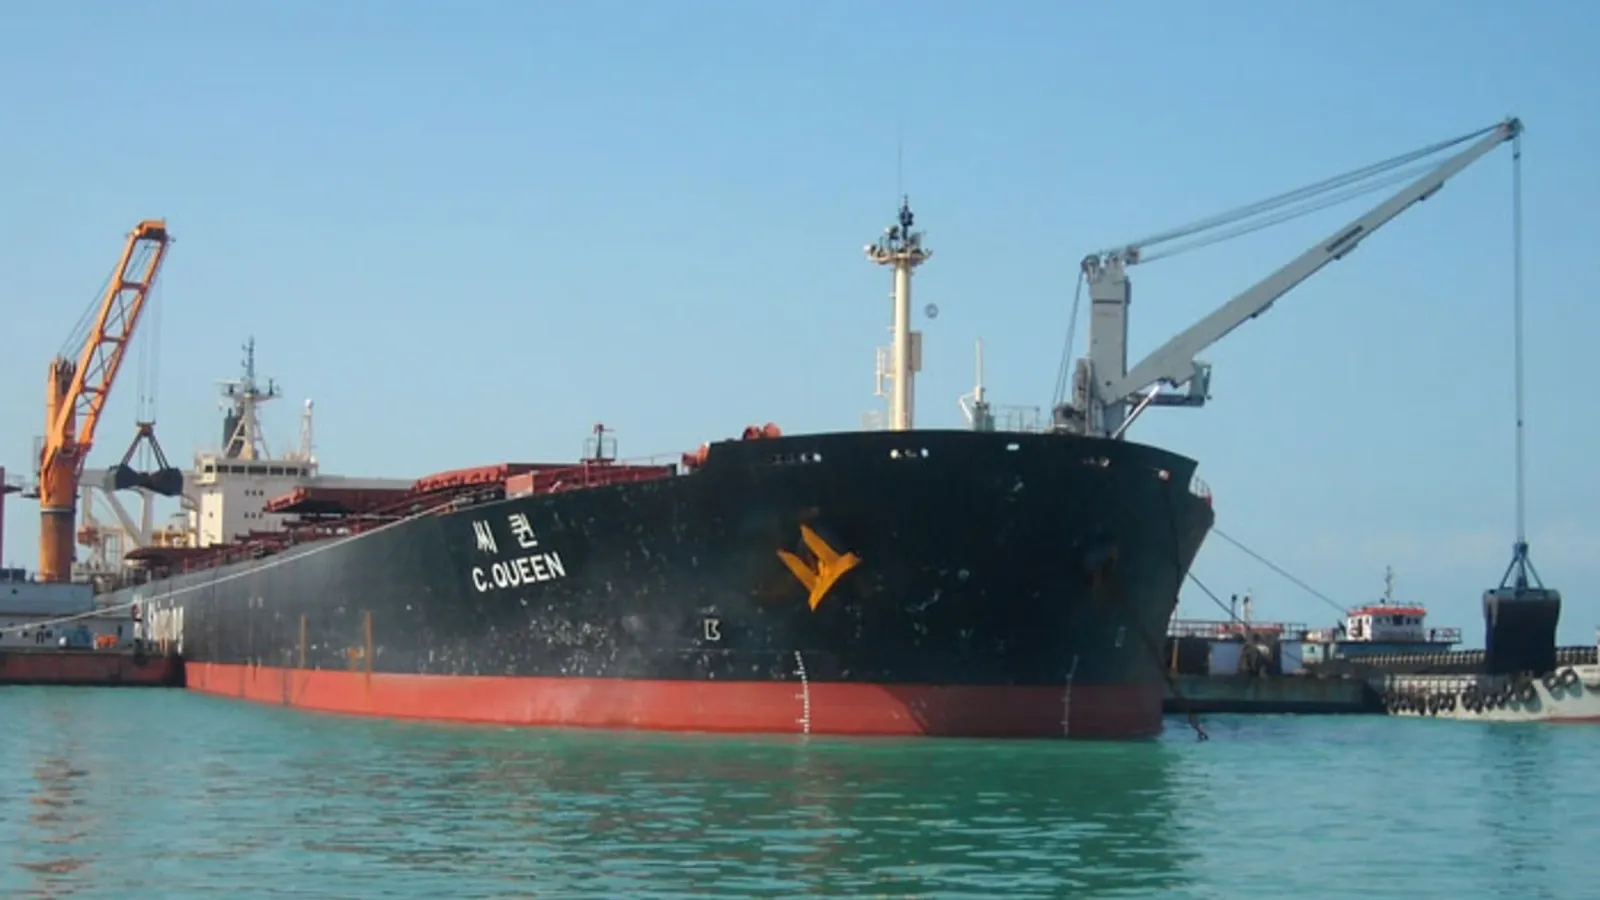
Shipping Minister Sarbananda Sonowal on Monday, November 16, said the government is developing five greenfield shipbuilding clusters across Andhra Pradesh, Gujarat, Maharashtra, Odisha and Tamil Nadu.
as of 21/11/2026, 6:50:21 pm
02/Price history
Max · monthly candles. Hover the chart for the OHLC of any candle; the table below holds the same data row by row.
| 1 Nov 2026 | 619.00 | 773.40 | 592.00 | 716.70 | +15.78% | 181.40 | 1.28 Cr |
| 1 Oct 2026 | 604.00 | 681.80 | 580.00 | 619.00 | +2.48% | 101.80 | 1.34 Cr |
| 1 Sept 2026 | 587.00 | 635.00 | 497.80 | 608.30 | +3.63% | 137.20 | 1.29 Cr |
| 1 Aug 2026 | 494.10 | 616.00 | 483.10 | 584.90 | +18.38% | 132.90 | 1.23 Cr |
| 1 Jul 2026 | 459.80 | 547.40 | 418.90 | 492.70 | +7.16% | 128.50 | 1.35 Cr |
| 1 Jun 2026 | 378.00 | 481.80 | 342.30 | 458.40 | +21.27% | 139.50 | 1.43 Cr |
| 1 May 2026 | 362.00 | 457.10 | 360.50 | 383.70 | +5.99% | 96.60 | 2.08 Cr |
| 1 Apr 2026 | 307.10 | 376.00 | 301.50 | 353.90 | +15.24% | 74.50 | 1.04 Cr |
| 1 Mar 2026 | 300.40 | 343.00 | 281.80 | 293.20 | -2.40% | 61.20 | 89.33 L |
| 1 Feb 2026 | 360.80 | 381.00 | 307.30 | 319.50 | -11.45% | 73.70 | 1.37 Cr |
Historical price and volume data · Showing 1–10 of 25
03/Valuation & returns
Company value benchmarked against the sector median. The ratio set is sector specific — banks report NIM, CASA and Net NPA instead of EV/EBITDA.
Price ÷ earnings per share
Worse than sector by 311%
Price ÷ book value per share
Worse than sector by 122%
Net income ÷ total assets
Worse than sector by 96%
Net income ÷ shareholders' equity
Better than sector by 1%
EBIT ÷ capital employed
Worse than sector by 18%
Liquid assets ÷ current liabilities
Worse than sector by 57%
Enterprise value ÷ EBITDA
Worse than sector by 355%
04/Business
Sector: Miscellaneous
Knowledge Marine & Engineering Works Limited is engaged in the business of providing dredging services, owning, chartering/hiring along with manning, operation and technical maintenance of marine crafts, repair/maintenance of marine crafts and marine infrastructure and allied works in India. Its geographical segments include India and Myanmar. Its fleet includes a pilot boat, a speed patrol boat, a survey boat, a grab dredger, a trailing suction hopper dredger, mooring launches, a hopper boat, a backhoe dredger and a service boat. Its operational marine assets include River Pearl 1, River Pearl 2, River Pearl 3, River Pearl 4, River Pearl 5, River Pearl 6, River Pearl 7, River Pearl 8, River Pearl 9, River Pearl 10, River Pearl 11, and River Pearl 12. The Company's subsidiaries include Knowledge dredging Co. W.L.L., Knowledge Marine Co. W.L.L., Knowledge Infra Ports Private Limited, Indian Ports Dredging Private Limited, and KMEW Offshore Private Limited.
reported in crore
reported in billion
Market capitalisation is reported at the sector-constituent level, not the standalone company level.
05/Profit & loss
Quarterly figures in ₹ crore. Growth marked reported is provided; margins are derived.
| Revenue | 74 | 119 | 76 | 86 |
|---|---|---|---|---|
| Revenue growthreported | -37.4% | 55.0% | -10.8% | — |
| Operating profit | 22 | 63 | 26 | 30 |
| Operating profit growthreported | -64.3% | 145.3% | -15.1% | — |
| Operating marginderived | 30.2% | 53.0% | 33.5% | 35.2% |
| Net profit | 17 | 61 | 31 | 30 |
| Net profit growthreported | -72.0% | 98.6% | 1.4% | — |
| Net marginderived | 22.9% | 51.3% | 40.0% | 35.2% |
| EPS — basic₹/share, annual | — | — | 34.10 | — |
Figures in ₹ crore. Margin rows are computed from the reported values.
| Revenue | 225 | 149 | 139 | 195 |
|---|---|---|---|---|
| Other Income | 19 | 5 | 3 | 1 |
| Total Revenue | 244 | 155 | 142 | 196 |
| Total Expenses | 167 | 107 | 107 | 133 |
| Profit Before Tax | 77 | 48 | 35 | 63 |
| Tax | -1 | 13 | 10 | 16 |
| Profit After Tax | 78 | 35 | 25 | 47 |
| EPS - Basic | 34.10 | 16.19 | 23.12 | 44.83 |
| EPS - Diluted | 34.03 | 16.19 | 23.12 | 44.83 |
This breakdown is available annually, even when the summary above is quarterly. EPS rows are per share.
06/Balance sheet
Only annual balance sheets are available — the quarterly filter does not apply here. Figures in ₹ crore; net worth is assets minus liabilities.
| Total assets | 783 | 326 | 196 | 202 |
|---|---|---|---|---|
| Total liabilities | 237 | 132 | 37 | 71 |
| Net worthderived | 545 | 194 | 159 | 131 |
| Liabilities ÷ assetsderived | 30.3% | 40.6% | 18.9% | 35.2% |
| Asset growthderived | 140.0% | 66.5% | -3.2% | — |
Figures in ₹ crore. Stacked chart height equals total assets.
| Non-Current Assets | 676 | 239 | 111 | 76 |
|---|---|---|---|---|
| Current Assets | 106 | 87 | 85 | 126 |
| Total Assets | 783 | 326 | 196 | 202 |
| Current Liabilities | 127 | 57 | 28 | 63 |
| Net Current Asset | -21 | 30 | 56 | 64 |
| Non-Current Liabilities | 110 | 76 | 9 | 8 |
| Equity Capital | 545 | 194 | 159 | 131 |
| Total Equity & Liabilities | 783 | 326 | 196 | 202 |
Figures in ₹ crore unless the line item is per-share.
07/Cash flow
Annual only, in ₹ crore. Negative values are outflows, so healthy companies usually show positive operating and negative investing cash flow.
| Operating activities | 48 | 40 | 45 | 18 |
|---|---|---|---|---|
| Operating changereported | 19.4% | -11.0% | 149.4% | — |
| Investing activities | -419 | -103 | -32 | -24 |
| Investing changereported | -305.5% | -222.7% | -33.4% | — |
| Financing activities | 388 | 77 | -21 | 41 |
| Financing changereported | 404.0% | 460.3% | -152.4% | — |
| Net cash flowderived | 17 | 14 | -8 | 35 |
| Free cash flowoperating + investing | -371 | -63 | 13 | -6 |
Figures in ₹ crore.
| Profit before tax | 77 | 48 | 37 | 63 |
|---|---|---|---|---|
| Income before WC changes | 89 | 57 | 43 | 68 |
| Change in Assets | -30 | -12 | 28 | -65 |
| Change in Liabilities | -0 | 1 | -18 | 30 |
| Change in WC | -30 | -11 | 11 | -35 |
| Cash flow from Operations | 48 | 40 | 45 | 18 |
| Cash flow from Investing | -419 | -103 | -32 | -24 |
| Cash flow from Financing | 388 | 77 | -21 | 41 |
| Total Cash Flow | 17 | 14 | -8 | 35 |
| Cash (Start of the year) | 23 | 9 | 53 | 18 |
| Cash (End of the year) | 40 | 23 | 45 | 53 |
Figures in ₹ crore unless the line item is per-share.
09/Events
Dividends, bonuses, splits and rights issues. Filter by type, sort by any date, and expand a row for the full event detail.
| Split | 1:5 | — | 06 Nov 2026 | 06 Nov 2026 | 14 Aug 2026 | |
| Split | 5:10 | — | 22 Dec 2025 | 22 Dec 2025 | 14 Nov 2025 |
10/Comparison
Competitor set priced live. Filter by sector, sort any column, and expand a peer for its business description.
| GMRAIRPORTGMR Airports Limited | Infrastructure | ₹105.00 | +0.96% | 1.16 Cr | ₹1,11,770 Cr | $12.42B | |
| NBCCNbcc (india) Limited | Construction | ₹79.60 | +0.13% | 73.21 L | ₹21,470 Cr | $2.39B | |
| IGILIntl Gemological Inst Ltd | Miscellaneous | ₹421.50 | -3.61% | 10.91 L | ₹18,229 Cr | $2.03B | |
| HORIZONINDHorizon Industrial Prks L | Miscellaneous | ₹48.89 | +0.02% | 44.09 L | ₹14,095 Cr | $1.57B | |
| CMPDICentral Mine P N D Inst L | Miscellaneous | ₹180.16 | +0.90% | 6.98 L | ₹12,863 Cr | $1.43B | |
| RITESRites Limited | Engineering | ₹187.02 | -1.04% | 7.96 L | ₹8,987 Cr | $998.59M | |
| RENTOMOJORentomojo Limited | Miscellaneous | ₹559.45 | -1.93% | 4.59 L | ₹5,783 Cr | $642.56M | |
| LEAPINDLeap India Limited | Miscellaneous | ₹130.99 | -1.01% | 8.91 L | ₹5,747 Cr | $638.53M | |
| RAINRain Industries Limited | Petrochemicals | ₹162.58 | +0.71% | 16.85 L | ₹5,474 Cr | $608.23M | |
| IGLSPIRITSIGL Spirits Limited | Miscellaneous | ₹794.00 | -0.73% | 42.7K | ₹5,358 Cr | $595.35M |
Market cap is the sector-constituent figure reported per peer · Showing 1–10 of 10
11/Coverage
Articles published in the last seven days, paginated by the provider.

Shipping Minister Sarbananda Sonowal on Monday, November 16, said the government is developing five greenfield shipbuilding clusters across Andhra Pradesh, Gujarat, Maharashtra, Odisha and Tamil Nadu.
Showing 1–1 of 1 article