FUNDAMENTALS
EdgeFII/DII
MAZDOCKMazagon Dock Shipbuil Ltd
₹1,841.50-0.46%
Terminal
  • Overview
  • Price
  • Ratios
  • About
  • P&L
  • Balance
  • Cash flow
  • Holders
  • Actions
  • Peers
  • News
MAZDOCKNSE · EquityShip Building

Mazagon Dock Shipbuil Ltd

ISIN
INE249Z01020
Instrument key
NSE_EQ|INE249Z01020
Open in terminal Fundamentals cached for 6 hours
Last traded price
₹1,841.50-8.50 · -0.46%
Day rangecircuit ₹1,657.40 – ₹2,025.60
1,823.90
1,855.00

as of 21/11/2026, 5:45:20 pm

Open
₹1,842.00
Day high
₹1,855.00
Day low
₹1,823.90
Prev. close
₹1,850.00
Volume
4.21 L
VWAP
₹1,842.26

On this page

Company

  • Overview
  • Price chart
  • Key ratios
  • About

Statements

  • Profit & loss
  • Balance sheet
  • Cash flow

Ownership

  • Shareholding
  • Corporate actions
  • Peers

Market

  • News

02/Price history

Price chart

1 week · 15-minute candles. Hover the chart for the OHLC of any candle; the table below holds the same data row by row.

1D1W1M6M1Y5YMAX
Change · 1W
-1.58%
1,871.10 → 1,841.50
Period high
₹1,899.90
17/11/2026
Period low
₹1,817.10
19/11/2026
From high
-3.07%
+1.34% from low
Avg volume
18.2K
22.74 L total
Candles
125
52 up / 70 down
20 Nov 2026O 1,843.80H 1,843.80L 1,841.50C 1,841.50Vol 3.0K
SMA 20SMA 50Averages need 50 candles before they begin
Candle data125 rows of open, high, low, close and volumeShowHide
20 Nov 20261,843.801,843.801,841.501,841.50-0.12%2.303.0K
20 Nov 20261,846.401,846.401,838.301,843.80-0.14%8.1037.0K
20 Nov 20261,844.801,848.001,842.901,845.40+0.03%5.1014.5K
20 Nov 20261,848.901,849.201,843.001,844.60-0.23%6.2012.0K
20 Nov 20261,848.201,850.001,846.101,848.00-0.01%3.9013.2K
20 Nov 20261,848.401,851.501,843.701,849.00+0.03%7.8011.4K
20 Nov 20261,850.201,852.501,846.401,847.00-0.17%6.108.5K
20 Nov 20261,849.301,851.801,849.101,850.20+0.05%2.704.7K
20 Nov 20261,846.001,852.001,844.401,850.00+0.22%7.6015.2K
20 Nov 20261,844.401,848.001,843.801,845.60+0.07%4.207.8K

Historical price and volume data · Showing 1–10 of 125

1 / 13

03/Valuation & returns

Key ratios vs sector

Company value benchmarked against the sector median. The ratio set is sector specific — banks report NIM, CASA and Net NPA instead of EV/EBITDA.

P/E

Price ÷ earnings per share

30.33
Company
30.33
Sector
21.57

Worse than sector by 41%

P/B

Price ÷ book value per share

7.11
Company
7.11
Sector
4.66

Worse than sector by 53%

ROA

Net income ÷ total assets

9.07%
Company
9.07%
Sector
4.25%

Better than sector by 113%

ROE

Net income ÷ shareholders' equity

23.45%
Company
23.45%
Sector
27.03%

Worse than sector by 13%

ROCE

EBIT ÷ capital employed

26.84%
Company
26.84%
Sector
29.04%

Worse than sector by 8%

Quick Ratio

Liquid assets ÷ current liabilities

1.24
Company
1.24
Sector
0.74

Better than sector by 68%

EV/EBITDA

Enterprise value ÷ EBITDA

20.16
Company
20.16
Sector
12.62

Worse than sector by 60%

04/Business

About the company

Sector: Ship Building

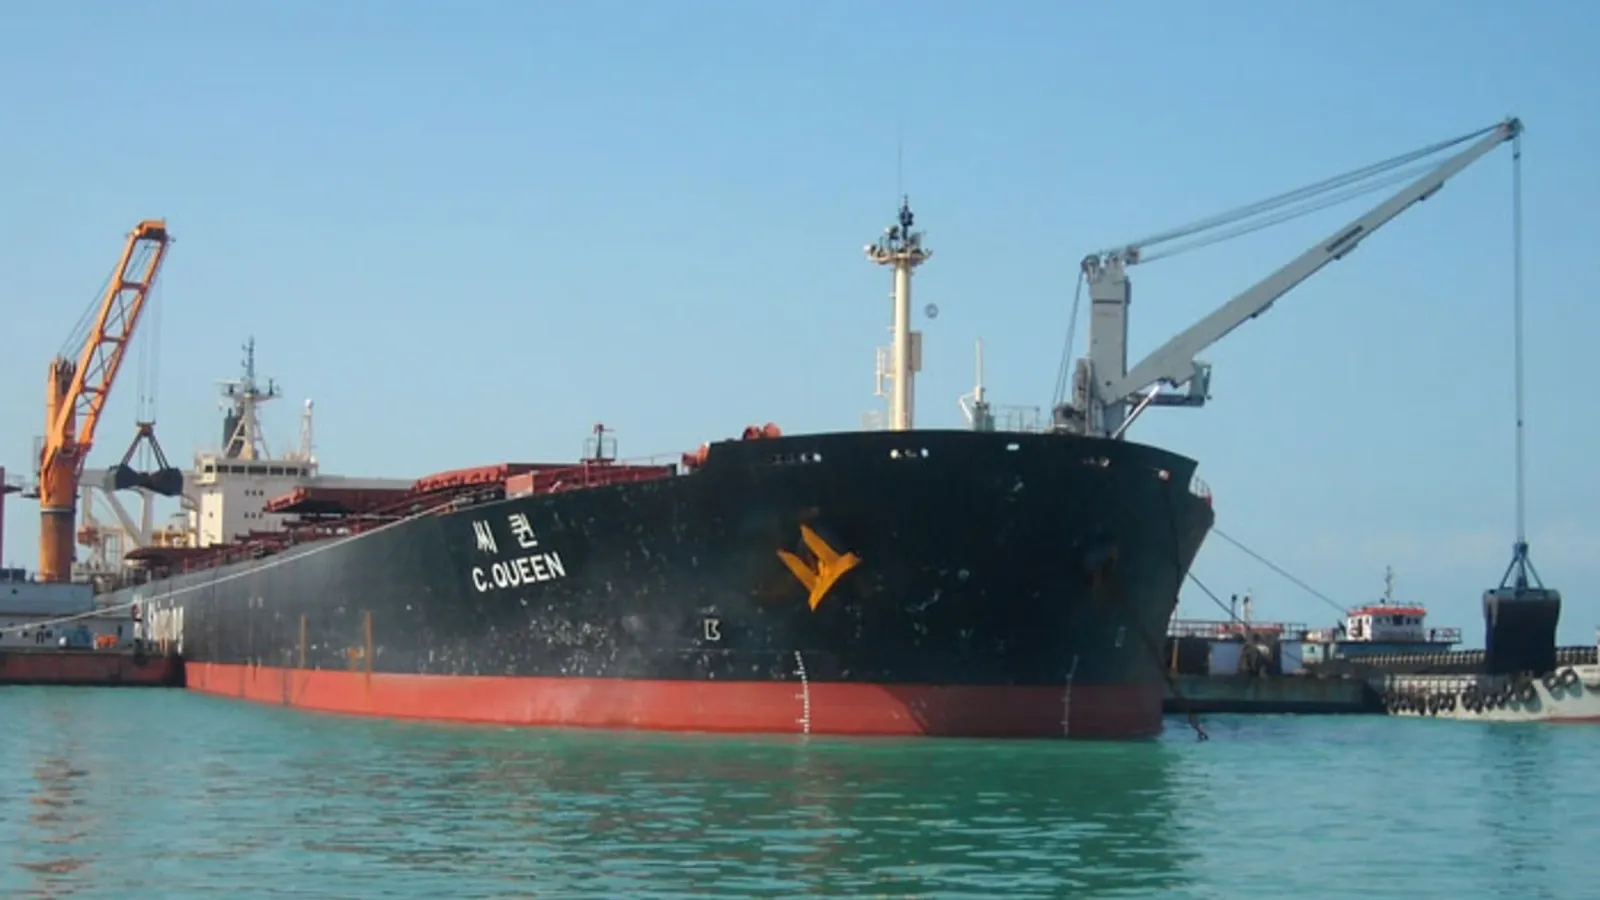
Mazagon Dock Shipbuilders Limited is an India-based shipbuilding yard company, which is principally engaged in the building and repairing of ships, submarines, various types of vessels, and related engineering products for its customers. It is also engaged in the production of defense equipment. The Company's segments include Shipbuilding (New Construction and Ship Repairs) and Submarine. Its Shipbuilding segment includes the building and repair of Naval ships. Its Submarine segment includes the building, repair and refits of diesel and electric submarines for the Indian Navy. It provides cargo ships, passenger ships, supply vessels, multipurpose support vessels, water tankers, tugs, dredgers, fishing trawlers, barges, and border outposts. The Company caters to both national and international customers in the defense sector as well as civil operations. It offers supply chain management, tug support, and yard services and berth facilities for repairs and refits of commercial vessels.

Sector market cap (INR)
₹74,343 Cr

reported in crore

Sector market cap (USD)
$8.26B

reported in billion

Market capitalisation is reported at the sector-constituent level, not the standalone company level.

05/Profit & loss

Consolidated income statement

Quarterly figures in ₹ crore. Growth marked reported is provided; margins are derived.

YearlyQuarterly
ConsolidatedStandalone
Revenue · Sep 2026
₹2,697 Cr
-16.65% vs Jun 2026
Net profit · Sep 2026
₹298 Cr
-41.82% vs Jun 2026
Operating margin
14.8%
was 21.2%
Revenue CAGR · 4p
-11.3%
profit -29.1% · op -29.1%
Filed order
Revenue2,6973,2364,1343,863
Revenue growthreported-16.6%-21.7%7.0%—
Operating profit3996867931,120
Operating profit growthreported-41.8%-13.5%-29.1%—
Operating marginderived14.8%21.2%19.2%29.0%
Net profit298512633837
Net profit growthreported-41.8%-19.1%-24.4%—
Net marginderived11.0%15.8%15.3%21.7%
EPS — basic₹/share, annual——64.04—

Figures in ₹ crore. Margin rows are computed from the reported values.

Full annual line itemsRevenue, other income, expenses, tax, EPSShowHide
Filed order
Revenue13,00611,4329,4677,827
Other Income1,1391,1121,101687
Total Revenue14,14612,54310,5688,514
Total Expenses10,9099,4828,1437,111
Profit Before Tax3,2373,0622,4251,403
Tax815784616357
Profit After Tax2,4222,2771,8091,046
EPS - Basic64.0459.8396.0455.48
EPS - Diluted64.0459.8396.0455.48

This breakdown is available annually, even when the summary above is quarterly. EPS rows are per share.

06/Balance sheet

Consolidated balance sheet

Only annual balance sheets are available — the quarterly filter does not apply here. Figures in ₹ crore; net worth is assets minus liabilities.

ConsolidatedStandalone
Total assets · Mar 2026
₹27,458 Cr
-4.35% YoY
Total liabilities
₹17,474 Cr
Net worth
₹9,984 Cr
Liabilities ÷ assets
63.6%
lower means a lighter balance sheet
Filed order
Total assets27,45828,70829,44929,463
Total liabilities17,47420,76823,20524,703
Net worthderived9,9847,9406,2434,760
Liabilities ÷ assetsderived63.6%72.3%78.8%83.8%
Asset growthderived-4.4%-2.5%-0.0%—

Figures in ₹ crore. Stacked chart height equals total assets.

Full annual line itemsNon-current & current assets, liabilities, equity capitalShowHide
Filed order
Non-Current Assets5,2033,9943,6613,378
Current Assets22,25524,71425,78826,085
Total Assets27,45828,70829,44929,463
Current Liabilities15,85619,82322,63424,140
Net Current Asset6,4004,8913,1541,945
Non-Current Liabilities1,618945571563
Equity Capital9,9847,9406,2434,760
Total Equity & Liabilities27,45828,70829,44929,463

Figures in ₹ crore unless the line item is per-share.

07/Cash flow

Consolidated cash flow

Annual only, in ₹ crore. Negative values are outflows, so healthy companies usually show positive operating and negative investing cash flow.

ConsolidatedStandalone
Operating · Mar 2026
-₹2,654 Cr
-226.25% YoY
Investing
₹1,166 Cr
Financing
-₹931 Cr
Free cash flow
-₹1,488 Cr
operating + investing
Filed order
Operating activities-2,6542,1026841,516
Operating changereported-226.3%207.4%-54.9%—
Investing activities1,166-1,2991,420-150
Investing changereported189.7%-191.5%1048.7%—
Financing activities-931-736-448-218
Financing changereported-26.5%-64.1%-105.7%—
Net cash flowderived-2,419671,6551,148
Free cash flowoperating + investing-1,4888032,1041,366

Figures in ₹ crore.

Full annual line itemsProfit before tax through closing cash balanceShowHide
Filed order
Profit before tax3,2373,0622,4251,403
Income before WC changes2,7212,9021,506870
Change in Assets-633,2961,3502,159
Change in Liabilities-4,327-3,153-1,495-1,202
Change in WC-4,390143-145958
Cash flow from Operations-2,6542,1026841,516
Cash flow from Investing1,166-1,2991,420-150
Cash flow from Financing-931-736-448-218
Total Cash Flow-2,419671,6551,148
Cash (Start of the year)5,3015,2181,868720
Cash (End of the year)2,8815,2853,5231,868

Figures in ₹ crore unless the line item is per-share.

08/Ownership

Shareholding pattern

Percentage of total shares by holder category across the last 4 reported quarters. Sort any quarter column to rank holders by size.

Promoters
81.22%
0.00 pts QoQ
FII
1.73%
+0.01 pts QoQ
DII (other)
3.62%
+0.02 pts QoQ
Mutual funds
1.47%
+0.06 pts QoQ
Retail & others
11.96%
-0.08 pts QoQ
Filed order
Promoters81.2%81.2%81.2%81.2%
FII1.7%1.7%1.7%1.8%
DII (other)3.6%3.6%3.6%3.6%
Mutual funds1.5%1.4%1.5%1.8%
Retail & others12.0%12.0%11.9%11.6%
Promoters — QoQ changepts, derived0.0%0.0%0.0%—
FII — QoQ changepts, derived0.0%-0.0%-0.1%—
DII (other) — QoQ changepts, derived0.0%0.0%-0.0%—
Mutual funds — QoQ changepts, derived0.1%-0.1%-0.3%—
Retail & others — QoQ changepts, derived-0.1%0.1%0.3%—
Totalderived100.0%100.0%100.0%100.0%

Values are percentages of total outstanding shares; QoQ rows are percentage-point moves.

09/Events

Corporate actions

Dividends, bonuses, splits and rights issues. Filter by type, sort by any date, and expand a row for the full event detail.

DividendInterim₹5.00100.0%03 Nov 202603 Nov 202627 Oct 2026
DividendFinal₹4.6292.4%20 Aug 202620 Aug 202630 Apr 2026
DividendInterim₹7.50150.0%13 Feb 202613 Feb 202605 Feb 2026

10/Comparison

Peers & competitors

Competitor set priced live. Filter by sector, sort any column, and expand a peer for its business description.

Sector
HALHindustan Aeronautics LtdAirlines₹4,809.00+1.03%4.93 L₹3,21,948 Cr$35.77B
BELBharat Electronics LtdEngineering₹402.00-0.54%45.75 L₹2,93,159 Cr$32.57B
SOLARINDSSolar Industries (i) LtdChemicals₹18,710.00-0.74%48.8K₹1,68,945 Cr$18.77B
BDLBharat Dynamics LimitedDefence₹1,034.50+0.20%5.67 L₹37,873 Cr$4.21B
COCHINSHIPCochin Shipyard LimitedShip Building₹1,125.00-1.16%14.47 L₹29,597 Cr$3.29B
ITIITI LtdTelecommunication₹245.72-1.22%1.37 L₹23,650 Cr$2.63B
GRSEGarden Reach Ship&eng LtdShip Building₹2,061.70-1.16%1.70 L₹23,619 Cr$2.62B
DATAPATTNSData Patterns India LtdElectronics₹4,215.00+2.48%4.88 L₹23,601 Cr$2.62B
SIGMAADVINE933B01012IT - Software₹919.85-2.75%97.2K₹17,473 Cr$1.94B
MTARTECHMtar Technologies LimitedEngineering₹5,614.50-5.70%3.21 L₹17,255 Cr$1.92B

Market cap is the sector-constituent figure reported per peer · Showing 1–10 of 10

1 / 1

11/Coverage

Company news

Articles published in the last seven days, paginated by the provider.

5102050
  • Thumbnail: Defence stocks take off! Bharat Dynamics, BEL, Bharat Forge rally; 3 key triggers driving the gains
    2d ago19/11/2026, 10:00:18 am
    Defence stocks take off! Bharat Dynamics, BEL, Bharat Forge rally; 3 key triggers driving the gains

    The Ministry of Defence signed the contract on Wednesday under the Other Capital Procurement Procedure. The agreement covers comprehensive hardware and software upgrades, along with obsolescence management, of the missile defence systems deployed on Indian Navy warships.

  • Thumbnail: From shipyards to stock markets: India’s $8 billion maritime push puts these companies in focus
    4d ago17/11/2026, 12:52:53 pm
    From shipyards to stock markets: India’s $8 billion maritime push puts these companies in focus

    Shipping Minister Sarbananda Sonowal on Monday, November 16, said the government is developing five greenfield shipbuilding clusters across Andhra Pradesh, Gujarat, Maharashtra, Odisha and Tamil Nadu.

Showing 1–2 of 2 articles