FUNDAMENTALS
EdgeFII/DII
SAILSail
₹164.11-0.19%
Terminal
  • Overview
  • Price
  • Ratios
  • About
  • P&L
  • Balance
  • Cash flow
  • Holders
  • Actions
  • Peers
  • News
SAILNSE · EquitySteel & Iron Products

Sail

ISIN
INE114A01011
Instrument key
NSE_EQ|INE114A01011
Open in terminal Fundamentals cached for 6 hours
Last traded price
₹164.11-0.32 · -0.19%
Day rangecircuit ₹147.70 – ₹180.52
159.01
165.03

as of 21/11/2026, 2:50:30 pm

Open
₹162.29
Day high
₹165.03
Day low
₹159.01
Prev. close
₹164.43
Volume
1.44 Cr
VWAP
₹162.77

On this page

Company

  • Overview
  • Price chart
  • Key ratios
  • About

Statements

  • Profit & loss
  • Balance sheet
  • Cash flow

Ownership

  • Shareholding
  • Corporate actions
  • Peers

Market

  • News

02/Price history

Price chart

5 years · weekly candles. Hover the chart for the OHLC of any candle; the table below holds the same data row by row.

1D1W1M6M1Y5YMAX
Change · 5Y
+48.52%
110.50 → 164.11
Period high
₹209.70
11/5/2026
Period low
₹63.60
20/6/2022
From high
-21.74%
+158.03% from low
Avg volume
11.62 Cr
3043.84 Cr total
Volatility · ann.
35.0%
262 candles · 127 up / 134 down
16 Nov 2026O 175.60H 175.60L 159.01C 164.11Vol 7.11 Cr
SMA 20SMA 50Averages need 50 candles before they begin
Candle data262 rows of open, high, low, close and volumeShowHide
16 Nov 2026175.60175.60159.01164.11-6.54%16.597.11 Cr
9 Nov 2026172.20181.20167.41176.20+2.32%13.798.01 Cr
2 Nov 2026161.35173.64161.35171.20+6.10%12.298.98 Cr
26 Oct 2026164.10173.95159.00161.00-1.89%14.958.03 Cr
19 Oct 2026171.00172.72161.31164.34-3.89%11.414.55 Cr
12 Oct 2026172.50177.25167.06170.95-0.90%10.196.09 Cr
5 Oct 2026174.21180.45165.76171.55-1.53%14.699.58 Cr
28 Sept 2026185.71188.22170.67174.50-6.04%17.557.74 Cr
21 Sept 2026178.00191.36174.00185.00+3.93%17.369.02 Cr
14 Sept 2026179.53180.00170.50177.33-1.23%9.504.32 Cr

Historical price and volume data · Showing 1–10 of 262

1 / 27

03/Valuation & returns

Key ratios vs sector

Company value benchmarked against the sector median. The ratio set is sector specific — banks report NIM, CASA and Net NPA instead of EV/EBITDA.

P/E

Price ÷ earnings per share

12.12
Company
12.12
Sector
12.52

Better than sector by 3%

P/B

Price ÷ book value per share

1.09
Company
1.09
Sector
2.0

Better than sector by 45%

ROA

Net income ÷ total assets

3.96%
Company
3.96%
Sector
3.31%

Better than sector by 20%

ROE

Net income ÷ shareholders' equity

8.96%
Company
8.96%
Sector
11.13%

Worse than sector by 19%

ROCE

EBIT ÷ capital employed

9.96%
Company
9.96%
Sector
10.26%

Worse than sector by 3%

Quick Ratio

Liquid assets ÷ current liabilities

0.28
Company
0.28
Sector
3.33

Worse than sector by 92%

EV/EBITDA

Enterprise value ÷ EBITDA

6.16
Company
6.16
Sector
9.78

Better than sector by 37%

04/Business

About the company

Sector: Steel & Iron Products

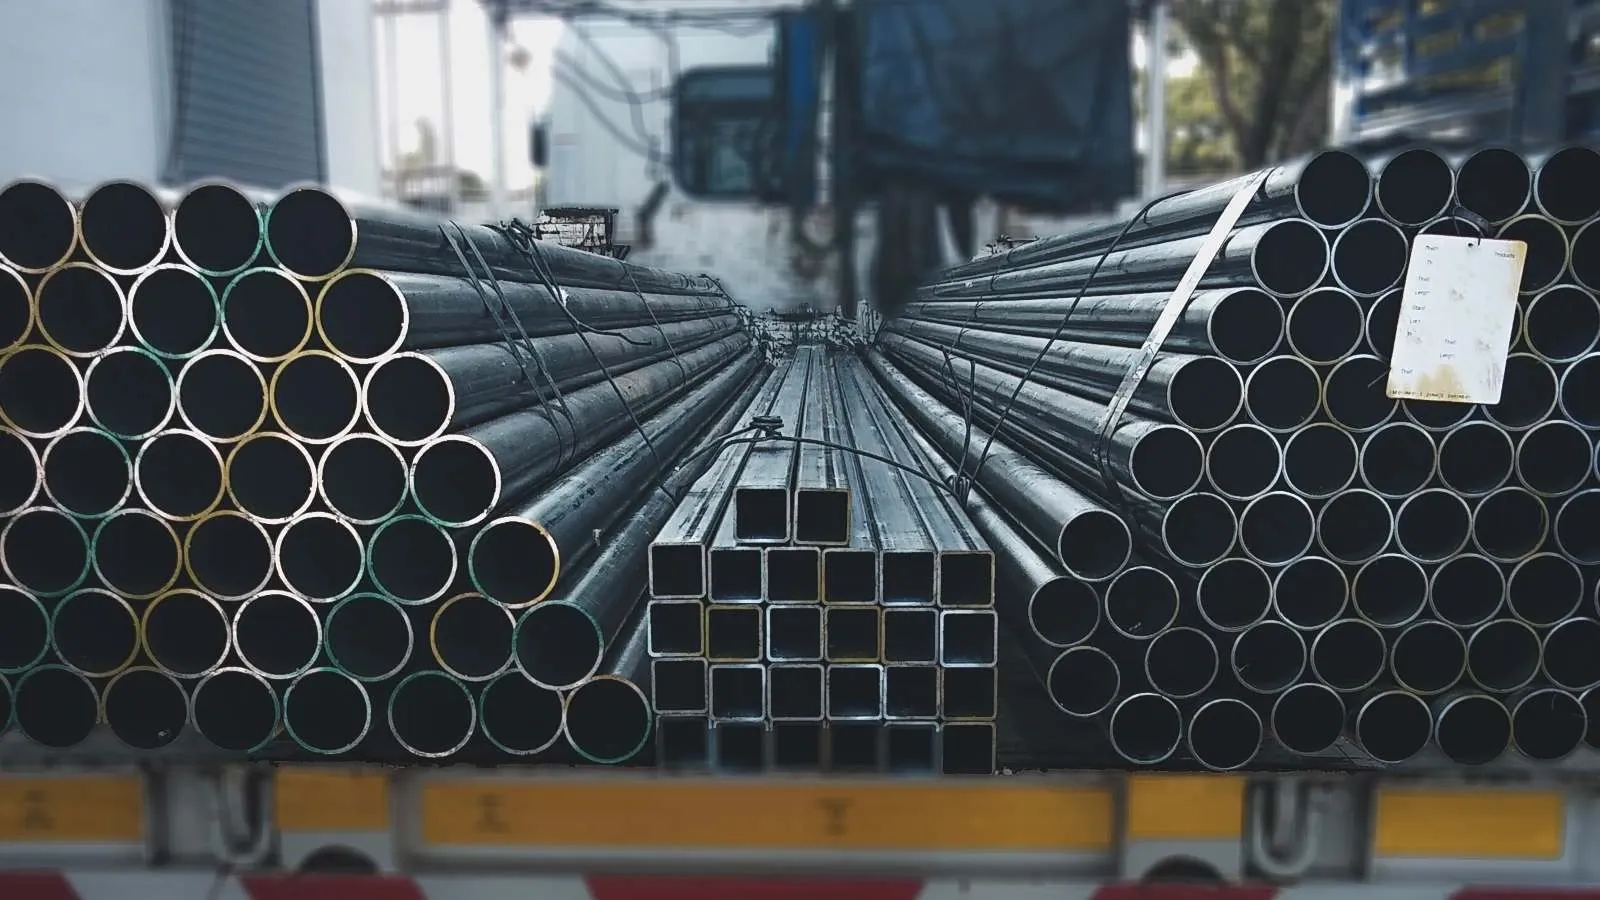
Steel Authority of India Limited is an India-based company, which is engaged in the steel manufacturing business. The Company is engaged in the manufacturing and sale of iron and steel products. Its business includes integrated steel plants and special steel plants. Its steel plants include Bhilai Steel Plant, Chhattisgarh; Durgapur Steel Plant, West Bengal; Rourkela Steel Plant, Odisha; Bokaro Steel Plant, Jharkhand; IISCO Steel Plant, West Bengal; Alloy Steels Plant, West Bengal; Salem Steel Plant, Tamil Nadu; Visvesvaraya Iron & Steel Plant, Karnataka, and Chandrapur Ferro Alloy Plant, Maharashtra. Its products include Pig Iron, Cold Rolled Products, Pipes, SAIL TMT Bars, Structurals, Galvanished products, Wire rods, PM Plates, Stainless Steel Products, Electrical Steels, Wheels and Axles, SAIL SeQR TMT Bars, Railway Products, Hot Rolled Products, and others. The Company's subsidiaries include SAIL Refractory Company Limited and Chhattisgarh Mega Steel Limited.

Sector market cap (INR)
₹67,947 Cr

reported in crore

Sector market cap (USD)
$7.55B

reported in billion

Market capitalisation is reported at the sector-constituent level, not the standalone company level.
05/Profit & loss

Standalone income statement

Quarterly figures in ₹ crore. Growth marked reported is provided; margins are derived.

YearlyQuarterly
ConsolidatedStandalone
Revenue · Sep 2026
₹32,339 Cr
+22.27% vs Jun 2026
Net profit · Sep 2026
₹1,774 Cr
+8.42% vs Jun 2026
Operating margin
7.3%
was 8.2%
Revenue CAGR · 4p
5.3%
profit 58.9% · op 60.7%
Filed order
Revenue32,33926,44931,16927,703
Revenue growthreported22.3%-15.1%12.5%—
Operating profit2,3562,1592,324568
Operating profit growthreported9.2%-7.1%309.4%—
Operating marginderived7.3%8.2%7.5%2.0%
Net profit1,7741,6361,680442
Net profit growthreported8.4%-2.6%280.2%—
Net marginderived5.5%6.2%5.4%1.6%
EPS — basic₹/share, annual——7.83—

Figures in ₹ crore. Margin rows are computed from the reported values.

Full annual line itemsRevenue, other income, expenses, tax, EPSShowHide
Filed order
Revenue1,10,8101,02,4781,05,3751,04,447
Other Income1,1511,1341,1481,355
Total Revenue1,11,9611,03,6131,06,5231,05,802
Total Expenses1,06,9591,00,2911,01,9941,03,423
Profit Before Tax4,3343,0093,6882,637
Tax1,100861955734
Profit After Tax3,2332,1482,7331,903
EPS - Basic7.835.206.624.61
EPS - Diluted7.835.206.624.61

This breakdown is available annually, even when the summary above is quarterly. EPS rows are per share.

06/Balance sheet

Standalone balance sheet

Only annual balance sheets are available — the quarterly filter does not apply here. Figures in ₹ crore; net worth is assets minus liabilities.

ConsolidatedStandalone
Total assets · Mar 2026
₹1.33L Cr
+0.25% YoY
Total liabilities
₹75,057 Cr
Net worth
₹58,195 Cr
Liabilities ÷ assets
56.3%
lower means a lighter balance sheet
Filed order
Total assets1,33,2531,32,9181,37,5321,27,715
Total liabilities75,05777,26283,40275,576
Net worthderived58,19555,65654,13152,139
Liabilities ÷ assetsderived56.3%58.1%60.6%59.2%
Asset growthderived0.3%-3.4%7.7%—

Figures in ₹ crore. Stacked chart height equals total assets.

Full annual line itemsNon-current & current assets, liabilities, equity capitalShowHide
Filed order
Non-Current Assets97,48891,22989,66589,985
Current Assets35,76541,68947,86737,730
Total Assets1,33,2531,32,9181,37,5321,27,715
Current Liabilities43,62746,02953,42549,305
Net Current Asset-7,862-4,339-5,558-11,575
Non-Current Liabilities31,43031,23329,97626,270
Equity Capital58,19555,65654,13152,139
Total Equity & Liabilities1,33,2531,32,9181,37,5321,27,715

Figures in ₹ crore unless the line item is per-share.

07/Cash flow

Standalone cash flow

Annual only, in ₹ crore. Negative values are outflows, so healthy companies usually show positive operating and negative investing cash flow.

ConsolidatedStandalone
Operating · Mar 2026
₹19,007 Cr
+92.22% YoY
Investing
-₹7,874 Cr
Financing
-₹11,409 Cr
Free cash flow
₹11,133 Cr
operating + investing
Filed order
Operating activities19,0079,8882,933-5,406
Operating changereported92.2%237.1%154.3%—
Investing activities-7,874-5,233-4,280-3,234
Investing changereported-50.5%-22.3%-32.4%—
Financing activities-11,409-4,3841,3548,587
Financing changereported-160.3%-423.7%-84.2%—
Net cash flowderived-2762727-53
Free cash flowoperating + investing11,1334,655-1,347-8,640

Figures in ₹ crore.

Full annual line itemsProfit before tax through closing cash balanceShowHide
Filed order
Profit before tax4,3343,0093,6882,637
Income before WC changes11,87710,96810,7168,835
Change in Assets5,7697,022-9,492-10,035
Change in Liabilities2,042-7,4641,802-3,788
Change in WC7,811-442-7,690-13,822
Cash flow from Operations19,0079,8882,933-5,406
Cash flow from Investing-7,874-5,233-4,280-3,234
Cash flow from Financing-11,409-4,3841,3548,587
Total Cash Flow-2762727-53
Cash (Start of the year)28614660
Cash (End of the year)10286146

Figures in ₹ crore unless the line item is per-share.

08/Ownership

Shareholding pattern

Percentage of total shares by holder category across the last 4 reported quarters. Sort any quarter column to rank holders by size.

Promoters
65.00%
0.00 pts QoQ
FII
7.31%
+0.22 pts QoQ
DII (other)
6.55%
-1.57 pts QoQ
Mutual funds
9.95%
+1.21 pts QoQ
Retail & others
11.20%
+0.15 pts QoQ
Filed order
Promoters65.0%65.0%65.0%65.0%
FII7.3%7.1%5.0%4.5%
DII (other)6.5%8.1%9.7%10.7%
Mutual funds9.9%8.7%8.7%7.2%
Retail & others11.2%11.1%11.6%12.6%
Promoters — QoQ changepts, derived0.0%0.0%0.0%—
FII — QoQ changepts, derived0.2%2.1%0.5%—
DII (other) — QoQ changepts, derived-1.6%-1.6%-1.0%—
Mutual funds — QoQ changepts, derived1.2%0.1%1.5%—
Retail & others — QoQ changepts, derived0.1%-0.5%-1.0%—
Totalderived100.0%100.0%100.0%100.0%

Values are percentages of total outstanding shares; QoQ rows are percentage-point moves.

09/Events

Corporate actions

Dividends, bonuses, splits and rights issues. Filter by type, sort by any date, and expand a row for the full event detail.

DividendFinal₹2.3523.5%30 Sep 202630 Sep 202622 May 2026

10/Comparison

Peers & competitors

Competitor set priced live. Filter by sector, sort any column, and expand a peer for its business description.

JSWSTEELJSW Steel LimitedSteel & Iron Products₹1,337.00+0.01%23.44 L₹3,27,691 Cr$36.41B
TATASTEELTata Steel LimitedSteel & Iron Products₹178.00-1.60%4.62 Cr₹2,21,895 Cr$24.65B
JINDALSTELJindal Steel LimitedSteel & Iron Products₹1,131.90+1.56%12.71 L₹1,14,796 Cr$12.76B
JSLJindal Stainless LimitedSteel & Iron Products₹736.65+0.01%2.58 L₹60,686 Cr$6.74B
SHYAMMETLShyam Metalics And Engy LSteel & Iron Products₹1,314.30+1.57%2.14 L₹36,663 Cr$4.07B
SARDAENSarda Energy & MIN LtdSteel & Iron Products₹467.70-1.76%2.12 L₹16,520 Cr$1.84B
GPILGodawari POW & ISP LtdSteel & Iron Products₹226.69-0.75%8.55 L₹15,248 Cr$1.69B
USHAMARTUsha Martin Ltd.Steel & Iron Products₹461.15-2.84%2.78 L₹14,081 Cr$1.56B
GALLANTTGallantt Ispat LimitedSteel & Iron Products₹538.10-0.16%2.28 L₹12,997 Cr$1.44B
NSLNISPNmdc Steel LimitedSteel & Iron Products₹38.85-0.59%31.08 L₹11,385 Cr$1.27B

Market cap is the sector-constituent figure reported per peer · Showing 1–10 of 10

1 / 1

11/Coverage

Company news

Articles published in the last seven days, paginated by the provider.

5102050
  • Thumbnail: Hindalco, SAIL, Hindustan Zinc shares in focus as NIFTY Metal tumbles 2% on Nov 18; check details
    3d ago18/11/2026, 12:25:36 pm
    Hindalco, SAIL, Hindustan Zinc shares in focus as NIFTY Metal tumbles 2% on Nov 18; check details

    The NIFTY Metal index was among the worst-performing sectoral indices on the NSE, as it tumbled as much as 1.83% to reach an intraday low of 12,301.25 on Wednesday, November 18, down from the previous session’s close of 12,530.30.

Showing 1–1 of 1 article