The weakness in commodities comes amid a broader unwinding of the AI trade, as concerns over the sustainability of AI-led investments have prompted investors to reassess demand expectations for industrial metals such as copper.
as of 22/11/2026, 4:04:36 pm
02/Price history
6 months · daily candles. Hover the chart for the OHLC of any candle; the table below holds the same data row by row.
| 20 Nov 2026 | 236.80 | 238.20 | 231.85 | 238.04 | +0.52% | 6.35 | 1.86 Cr |
| 19 Nov 2026 | 241.54 | 244.15 | 240.74 | 243.70 | +0.89% | 3.41 | 89.83 L |
| 18 Nov 2026 | 252.90 | 253.75 | 245.00 | 245.40 | -2.97% | 8.75 | 98.39 L |
| 17 Nov 2026 | 251.70 | 257.90 | 249.18 | 255.03 | +1.32% | 8.72 | 86.92 L |
| 16 Nov 2026 | 257.31 | 257.31 | 251.50 | 253.00 | -1.68% | 5.81 | 90.32 L |
| 13 Nov 2026 | 258.00 | 261.12 | 256.10 | 259.68 | +0.65% | 5.02 | 66.78 L |
| 12 Nov 2026 | 263.80 | 264.47 | 259.13 | 260.40 | -1.29% | 5.34 | 71.86 L |
| 11 Nov 2026 | 263.45 | 263.97 | 260.85 | 263.88 | +0.16% | 3.12 | 1.06 Cr |
| 9 Nov 2026 | 263.00 | 263.97 | 258.31 | 262.00 | -0.38% | 5.66 | 97.24 L |
| 8 Nov 2026 | 263.08 | 265.41 | 260.80 | 261.00 | -0.79% | 4.61 | 20.62 L |
Historical price and volume data · Showing 1–10 of 126
03/Valuation & returns
Company value benchmarked against the sector median. The ratio set is sector specific — banks report NIM, CASA and Net NPA instead of EV/EBITDA.
Price ÷ earnings per share
Better than sector by 84%
Price ÷ book value per share
Worse than sector by 133%
Net income ÷ total assets
Better than sector by 377%
Net income ÷ shareholders' equity
Better than sector by 313%
EBIT ÷ capital employed
Better than sector by 285%
Liquid assets ÷ current liabilities
Worse than sector by 83%
Enterprise value ÷ EBITDA
Worse than sector by 162%
04/Business
Sector: Metal
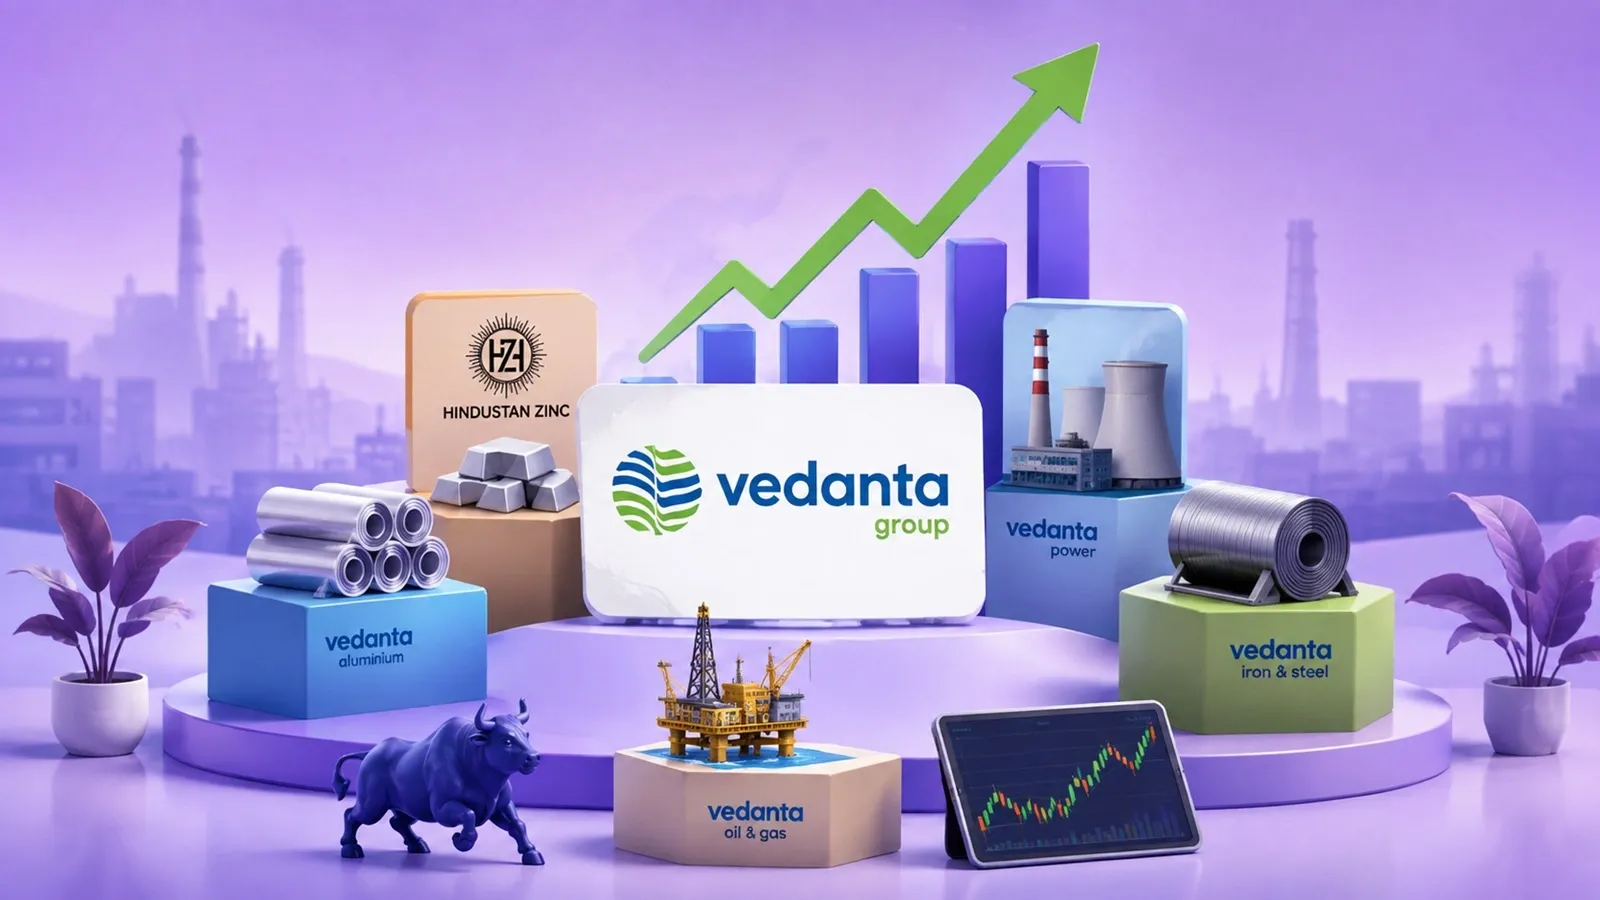
Vedanta Limited is an India-based company, which specializes in critical minerals, energy transition metals, power, and technology, with operations spanning India, South Africa, Namibia, Liberia, United Arab Emirates, Saudi Arabia, Korea, Taiwan and Japan. Its segments include Zinc, Lead and Silver - India; Zinc - International; Oil & Gas; Aluminium; Copper; Iron Ore; Power and Others. Zinc, Lead and Silver - India segment consists of mining of ore, manufacturing of zinc and lead ingots and silver, both from own mining and purchased concentrate. Zinc - International segment consists of exploration, mining, treatment and production of zinc, lead, copper and associated mineral concentrates for sale. Oil & Gas segment consists of exploration, development and production of oil and gas. Aluminium segment consists of mining of bauxite and manufacturing of alumina and various aluminum products. Iron ore segment consists of mining of ore and manufacturing of pig iron and metallurgical coke.
reported in crore
reported in billion
Market capitalisation is reported at the sector-constituent level, not the standalone company level.
05/Profit & loss
Annual figures in ₹ crore. Growth marked reported is provided; margins are derived.
| Revenue | 79,987 | 64,547 | 1,46,277 | 1,50,159 |
|---|---|---|---|---|
| Revenue growthreported | 23.9% | -55.9% | -2.6% | — |
| Operating profit | 17,197 | 11,628 | 20,365 | 20,276 |
| Operating profit growthreported | 47.9% | -42.9% | 0.4% | — |
| Operating marginderived | 21.5% | 18.0% | 13.9% | 13.5% |
| Net profit | 25,096 | 20,535 | 7,539 | 14,506 |
| Net profit growthreported | 22.2% | 172.4% | -48.0% | — |
| Net marginderived | 31.4% | 31.8% | 5.2% | 9.7% |
| EPS — basic₹/share, annual | 44.58 | 38.97 | 11.42 | 28.50 |
Figures in ₹ crore. Margin rows are computed from the reported values.
| Revenue | 78,437 | 62,717 | 1,43,727 | 1,47,308 |
|---|---|---|---|---|
| Other Income | 1,550 | 1,830 | 2,550 | 2,851 |
| Total Revenue | 79,987 | 64,547 | 1,46,277 | 1,50,159 |
| Total Expenses | 62,880 | 52,569 | 1,28,717 | 1,29,666 |
| Profit Before Tax | 17,126 | 11,628 | 20,365 | 20,276 |
| Tax | 4,646 | 2,352 | 12,826 | 5,770 |
| Profit After Tax | 12,480 | 9,276 | 7,539 | 14,506 |
| EPS - Basic | 44.58 | 38.97 | 11.42 | 28.50 |
| EPS - Diluted | 44.21 | 38.65 | 11.33 | 28.32 |
This breakdown is available annually, even when the summary above is quarterly. EPS rows are per share.
06/Balance sheet
Only annual balance sheets are available — the quarterly filter does not apply here. Figures in ₹ crore; net worth is assets minus liabilities.
| Total assets | 2,33,237 | 2,03,293 | 1,90,807 | 1,95,377 |
|---|---|---|---|---|
| Total liabilities | 1,64,660 | 1,49,540 | 1,48,738 | 1,45,950 |
| Net worthderived | 68,577 | 53,753 | 42,069 | 49,427 |
| Liabilities ÷ assetsderived | 70.6% | 73.6% | 78.0% | 74.7% |
| Asset growthderived | 14.7% | 6.5% | -2.3% | — |
Figures in ₹ crore. Stacked chart height equals total assets.
| Non-Current Assets | 2,06,427 | 1,51,528 | 1,38,883 | 1,34,870 |
|---|---|---|---|---|
| Current Assets | 26,810 | 51,765 | 51,924 | 60,507 |
| Total Assets | 2,33,237 | 2,03,293 | 1,90,807 | 1,95,377 |
| Current Liabilities | 35,023 | 73,575 | 78,661 | 87,047 |
| Net Current Asset | -8,213 | -21,810 | -26,737 | -26,540 |
| Non-Current Liabilities | 1,29,637 | 75,965 | 70,077 | 58,903 |
| Equity Capital | 68,577 | 53,753 | 42,069 | 49,427 |
| Total Equity & Liabilities | 2,33,237 | 2,03,293 | 1,90,807 | 1,95,377 |
Figures in ₹ crore unless the line item is per-share.
07/Cash flow
Annual only, in ₹ crore. Negative values are outflows, so healthy companies usually show positive operating and negative investing cash flow.
| Operating activities | 39,499 | 39,562 | 35,654 | 33,065 |
|---|---|---|---|---|
| Operating changereported | -0.2% | 11.0% | 7.8% | — |
| Investing activities | -24,338 | -19,190 | -13,686 | -693 |
| Investing changereported | -26.8% | -40.2% | -1874.9% | — |
| Financing activities | -13,549 | -19,223 | -26,092 | -34,142 |
| Financing changereported | 29.5% | 26.3% | 23.6% | — |
| Net cash flowderived | 1,612 | 1,149 | -4,124 | -1,770 |
| Free cash flowoperating + investing | 15,161 | 20,372 | 21,968 | 32,372 |
Figures in ₹ crore.
| Profit before tax | 35,426 | 26,877 | 20,365 | 20,276 |
|---|---|---|---|---|
| Income before WC changes | 55,494 | 43,310 | 36,787 | 34,823 |
| Change in Assets | -4,894 | 3,839 | 1,850 | 934 |
| Change in Liabilities | -2,965 | -4,504 | -298 | 3,665 |
| Change in WC | -7,859 | -665 | 1,552 | 4,599 |
| Cash flow from Operations | 39,499 | 39,562 | 35,654 | 33,065 |
| Cash flow from Investing | -24,338 | -19,190 | -13,686 | -693 |
| Cash flow from Financing | -13,549 | -19,223 | -26,092 | -34,142 |
| Total Cash Flow | 1,816 | 1,181 | -4,114 | -1,745 |
| Cash (Start of the year) | 3,993 | 2,812 | 6,926 | 8,671 |
| Cash (End of the year) | 5,809 | 3,993 | 2,812 | 6,926 |
Figures in ₹ crore unless the line item is per-share.
09/Events
Dividends, bonuses, splits and rights issues. Filter by type, sort by any date, and expand a row for the full event detail.
| DividendInterim | ₹5.00 | 500.0% | 14 Oct 2026 | 14 Oct 2026 | 05 Oct 2026 | |
| DividendInterim | ₹11.00 | 1100.0% | 27 Mar 2026 | 28 Mar 2026 | 18 Mar 2026 |
10/Comparison
Competitor set priced live. Filter by sector, sort any column, and expand a peer for its business description.
| HINDZINCHindustan Zinc Limited | Metal | ₹521.60 | -1.40% | 88.54 L | ₹2,20,562 Cr | $24.51B | |
| HINDALCOHindalco Industries Ltd | Metal | ₹929.50 | +2.14% | 88.86 L | ₹2,09,059 Cr | $23.23B | |
| VAMLVedanta Aluminium Metal L | Non Ferrous Metals | ₹365.55 | -1.47% | 1.19 Cr | ₹1,42,925 Cr | $15.88B | |
| NATIONALUMNational Aluminium CO Ltd | Aluminium Products | ₹303.20 | -1.24% | 1.15 Cr | ₹55,742 Cr | $6.19B | |
| HINDCOPPERHindustan Copper Ltd | Metal | ₹419.05 | -1.50% | 44.39 L | ₹40,523 Cr | $4.50B | |
| GRAVITAGravita India Limited | Metal | ₹1,484.90 | +1.84% | 1.23 L | ₹10,952 Cr | $1.22B | |
| JAINRECJain Resource Recycling L | Non Ferrous Metals | ₹288.10 | -1.67% | 12.33 L | ₹9,954 Cr | $1.11B | |
| PRECWIREPrecision Wires India Ltd | Cable | ₹380.85 | -0.42% | 3.10 L | ₹6,952 Cr | $772.47M | |
| KSHINTLKSH International Limited | Non Ferrous Metals | ₹1,013.05 | -3.58% | 1.45 L | ₹6,823 Cr | $758.09M | |
| SBCLShivalik Bimetal Con. Ltd | Metal | ₹939.60 | -2.89% | 1.41 L | ₹5,410 Cr | $601.10M |
Market cap is the sector-constituent figure reported per peer · Showing 1–10 of 10
11/Coverage
Articles published in the last seven days, paginated by the provider.

The weakness in commodities comes amid a broader unwinding of the AI trade, as concerns over the sustainability of AI-led investments have prompted investors to reassess demand expectations for industrial metals such as copper.

Group company Hindustan Zinc (HZL) is developing a 10-million-tonne-per-annum high-tech facility to recover valuable metals, including zinc, lead, silver and germanium, from mining waste.

The NIFTY Metal index was among the worst-performing sectoral indices on the NSE, as it tumbled as much as 1.83% to reach an intraday low of 12,301.25 on Wednesday, November 18, down from the previous session’s close of 12,530.30.

The Q2FY27 earnings season which started in October 2026 served as one of key factors behind the broad-based market recovery. Q2 earnings performance was heavily mixed across sectors. Metals, oil and gas, and IT rebounded sharply, while Automobile sector posted lower profits due to soaring raw material costs.

Vedanta Group stocks were trading higher, rising up to 3% on Tuesday, November 17, as investors focused on the Chairman's latest investment commitments and elevated metal prices in the market.